https://doi.org/10.22319/rmcp.v16i1.6683
Article
The network of cattle mobilized in Mexico for slaughter 2017-2021
Nicolás Callejas Juárez a*
Eduardo Domínguez Arrieta b
Nathaniel Alec Rogers Montoya c
Eugenio Guzmán Soria d
Gabriela Rodríguez Licea e
a Universidad Autónoma de Chihuahua. Facultad de Zootecnia y Ecología. Periférico Francisco R. Almada km 1, Colonia Pavis Borunda, 31453, Chihuahua, México.
b Universidad Autónoma de Chihuahua. Facultad de Contaduría y Administración. Chihuahua, México.
c Colegio de Postgraduados. Campus Montecillo. Recursos Genéticos y productividad. Texcoco, Estado de México. México.
d Tecnológico Nacional de México. Celaya-Campus II, Celaya, México.
e Universidad Autónoma del Estado de México. Extensión Ameca, Ameca de Juárez, Estado de México. México.
*Corresponding author: ncallejas@uach.mx
Abstract:
Social-network analysis (SNA) offers an alternative way to study the market of cattle destined for slaughter, making it possible to come up with measurements for the purpose of analyzing both the sources and destinations of the said animals. The research described here set out to determine the network structure of Mexico’s internal market of cattle mobilized for slaughter between 2017 and 2021. The structure of that market was analyzed using spatial-localization, economic-specialization, and network-density and specialization measurements. An average of 4.7 million cattle were mobilized each year in Mexico for slaughter, with 302 mobilization permits being applied for every day, each for an average of 42.7 heads of cattle. Relative market specialization was low, being higher for demand, but no different from that for supply (P>0.05). The market was characterized by intrastate trade, low network density, low input centrality, low output centrality and high levels of municipal market specialization. Hence, the national cattle-for-slaughter market has low specialization, high diversification and homophily.
Key words: Regional specialization, Market structure, Market cohesion, Livestock mobilization.
Received: 07/05/2024
Accepted: 21/10/2024
Introduction
Cattle mobilization is important in Mexico, where the overall cattle market is composed of six sub-markets with an annual average of 8.9 million heads of cattle being mobilized nationwide ― 53.5 % for slaughter, 44.5 % for fattening, 1.1 % for grazing, 0.5 % for breeding, 0.3 % for fairs, and 0.2 % for shows(1). Of the 3.9 million calves that are the foundation of Mexico’s meat production, 43.2 % were bred in the states of Chiapas and Veracruz, with one third of the nationwide total being mobilized to the states of Durango and San Luís Potosí(2). Furthermore, in the period 2017-2022, Mexico exported 1.1 million calves and heifers to the USA(3), 40 % of which were from the state of Chihuahua(4).
Cattle are mobilized in Mexico for various reasons, the first being to supply the meat market, which is made up of four products: cows, bulls, bullocks and heifers(5). The reason why cows enter the meat market are primarily due to culling(6), illness(7), and low financial yield(8), with it being common practice to slaughter pregnant cows(9). Bulls enter the meat market for similar reasons as cows, but the likelihood increases with age. There is a 47.0 % chance of cows aged 10 yr or more being slaughtered, and a 73.3 % probability for bulls of the same age(10). Bullocks and heifers are primarily destined for the meat market(2).
The availability of slaughterhouses in Mexico is another variable associated with the intrastate and inter-state mobilization of cattle. The country has 1,175 slaughterhouses for all animal species, a monthly installed capacity for the slaughter of 1’267,995 heads of cattle, and a 42.1 % utilized capacity(5). Moreover, with the exception of Mexico City, there are slaughterhouses for cattle in 31 of the 32 Mexican federal entities, with an installed capacity of 1.7 million heads per month(3).
The problem of having limited information about cattle for slaughter can be solved by triangulating data(11). Attributes (i.e. the volume and structure of mobilizations) and the source-destination relationships between livestock species determine market structure(2). Although Mexico has an important national cattle herd which amounted, in 2022, to 33.3 million heads(3), the National Cattle Census (NCC) reported 12.8 million heads of cattle more than the SIAP in 2021, and, in 2019, the National Agriculture-and-Livestock Survey (NALS) reported 1.5 million heads less than the NCC(12).
Social Network Analysis (SNA), an innovative tool for studying market structures, analyzes how linkage patterns assign resources within social systems, seeking to identify groups, central features and indirect links among network elements(13), while the structural variables of a network can be studied at four levels: i. total internal network, ii. individuals as nodes, iii. external networks, and iv. clusters within the network(14).
Besides the aforesaid variables, livestock activities are influenced by the availability of resources, the location of markets, workforce availability, soil, climate and technical conditions, all of which may rule out certain locations for specific productive activities(15). Moreover, the quality and yield of beef decrease in keeping with the distance travelled before slaughter(16).
Hence, the research described here set out to determine the network structure of Mexico’s internal market of cattle mobilized for slaughter between 2017 and 2021, positing that the number of heads per mobilization and market specialization determine the structure of the country’s cattle-for-slaughter network.
Material and methods
Materials
The analyzed information was the number of heads of cattle mobilized each day from all Mexico’s productive markets to all its consumer municipalities between 2017 and 2021. This information was obtained from the official register of all the Verification and Inspection Points (VIPs) of the National Agrofood Health, Innocuousness and Quality Service (Spanish abbreviation: SENASICA).
The observation units were the source and destination municipalities of mobilized cattle, and the measurement unit was the number of animals mobilized. Likewise, at the state level, the unit of observation was all the source and destination states of cattle mobilized for slaughter. To facilitate the handling of this information, the names of Mexico’s 32 federal entities (i.e. 31 states + Mexico City) were abbreviated in accordance with the ISO 3166-2 norm(17).
The municipal data were set out in Matrix (Aij), with i = 1, 2…,951 mobilized-cattle source municipalities and j =1, 2…,853 cattle-destination municipalities. The municipal data were set out in a national state-level matrix (Eij), with i =1, 2…,32 mobilized-cattle source states and j =1, 2…,32 mobilized-cattle destination states. The elements of the main diagonal, Aii, showed intrastate trade (aii) and the (aij) elements showed inter-state trade. For purposes of analysis, the Aij and Eij elements were converted into a dichotomy, with market relationships being assigned the number 1 (aij=1) and non-market ones the number (aij=0).
Methods
Two types of analysis were carried out, the first consisting in calculating the degree of cattle-mobilized-for-slaughter source-market and destination-market specialization based on location theory(1). The aim was to identify the similarity between the state-level and national market structures. The source markets were the zones (Xij) and the destination markets the regions, where i represented number of heads of cattle mobilized from the source market and j the number of heads of cattle received in the destination market.
The regional economic structure of state markets was analyzed using the location quotient (Qij) and the specialization coefficient (QR)(18). The location quotient (Qij) measures relative or interregional specialization; a Qij greater than 1 indicates a specialized market because its relative size is larger than that of the national market, whereas a Qij less than 1 indicates a non-specialized market. The specialization coefficient (QR) measures market diversification, ranging from 0 to 1. A QR value close to 1 indicates a diversified market, while a value closer to 0 suggests the market resembles the national market.
Qij=Viji=1nVijj=1nViji=1,j=1nVij ;QR=12I=1NViji=1nVij-j=1nViji=1,j=1nVij
where Vij = livestock in the destination market j from the market of origin i.
The second analysis, based on the SNA theory, consisted in examining the structure of the national network of cattle mobilized for slaughter by means of centrality and density measurements. The said calculations of density(19) and centrality(19) were carried out using Ucinet statistical software(20).
Density (D), which measures the market’s social structure and evaluates the cohesion between source cattle-for-slaughter markets (Mi) and destination cattle-for-slaughter markets, is the coefficient of actual markets (AMs) divided by possible markets (PMs). Centrality (C) evaluates the individual social structure of exit markets (cij) and entry markets (cji): while cij is the total number of actual destination markets (xj) and cji, was worked out in the same way. The bigger the number of actual markets, the more centrality there will be the more important the market will be within the national network.
The statistical analysis was descriptive, using average and standard-deviation statistics. The hypothesis was substantiated using t-student statistics with a 95% significance level. Meat prices were for the year 2022(3).
Results
Due to their location, only 34.1 % of Mexico’s 32 state-level cattle-for-slaughter markets were found to be specialized (Q>1). With regard to supply, the four smallest markets had 100 % specialization in all the destination markets to which they mobilized cattle, with the four biggest markets having only 6.0 % specialization. When it came to demand, only two small markets had 100 % specialization in all the markets that received cattle, with the five main markets having only 8.0 % specialization.
Likewise, regional economic structure shows a diversified market. The average specialization of the cattle market for slaughter was high, with supply at 80.7 ± 10.9 % and demand at 81.1 ± 11.4 %. However, the difference between supply and demand was not significant (P>0.05). Nevertheless, the economic structure was diversified for 62.5 % of the state-level supply markets and 46.9 % of the state-level demand markets. Furthermore, small markets were the most specialized ones in both supply and demand.
Supply
In the period 2017-2021, only 25.0 % of Mexico’s 2,446 municipalities and 95.0 % of its 32 federal entities supplied cattle for slaughter. Average annual supply was for 4.7 ± 0.3 million heads of cattle, with an average 3.4 % annual growth, equivalent to 35.9 % of the monthly installed capacity of all the cattle slaughterhouses in Mexico. Average annual demand at the municipal level was for 4,763.3 ± 35,499.4 heads of cattle, and for 149,382.8 ± 199,516 heads of cattle at the state level. Moreover, the cattle-for-slaughter market was characterized by intrastate trade, with 71.8 % of all the cattle mobilized for that purpose being sent to local slaughterhouses, while 52.8 % of national supply was concentrated in six municipalities. Hence, the national supply of cattle for slaughter in municipal markets was extremely heterogeneous, with 5.9 % of all municipalities accounting for 83.0 % of all such cattle. The municipalities of Tamuín in the state of San Luis Potosí and Tlahualilo in the state of Durango respectively supplied 13.5 % and 10.6 % of all cattle for slaughter. Other important supply municipalities were Mexicali in the state of Baja California (7.7 %), Ezequiel Montes in the state of Queretaro, Vista Hermosa in the state of Michoacán (7.4 %) and Querétaro in the state of Querétaro (6.6 %), the first three of which were characterized as suppliers of finished cattle.
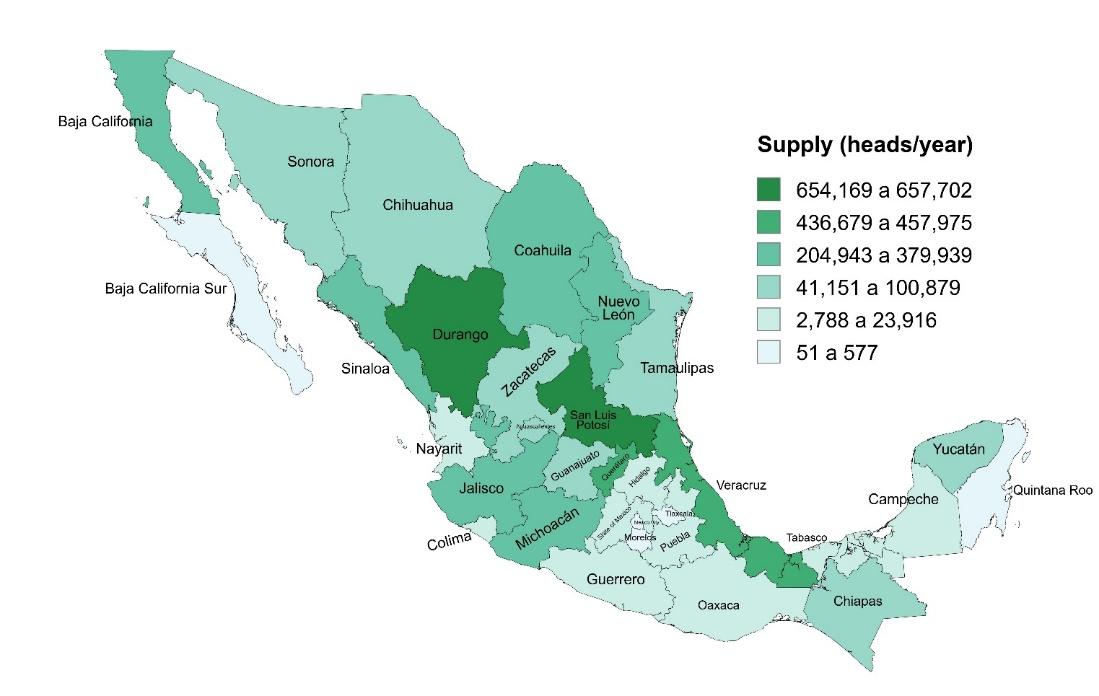
Based on the state supply of cattle for slaughter, it is possible to split the 32 state markets into six strata, two of them with high concentration levels. Of the markets, 25 % supplied up to 4,163 heads of cattle, 50 % up to 251,227 heads, and only one market up to 657,702 heads. The highest concentration of cattle was in the San Luis Potosí market (13.7 %) and the Durango market (13.7 %), both of which were characterized by intrastate trade (97.6 % and 69.3 % respectively) and finished cattle. The Veracruz market constituted 9.1 % of the national market, and the Jalisco with 4.5 %, while their intrastate trade made up 80.1 % and 8.1 % respectively. In other important markets such as Baja California, intrastate trade constituted 100 % of the state market, in Querétaro it constituted 15.4 %, and in Nuevo León it constituted 95.3 % (Figure 1).
Figure 1: Average annual state supply in Mexico of cattle for slaughter, 2017-2021
The dynamics of the sate supply of cattle for slaughter are attested to by the number of mobilization permits granted by SENASICA. An average of 306.4 permits per day were granted for the mobilization of 13,095 heads of cattle – i.e. 42.7 heads per permit. The market of the state of Queretaro was the most dynamic one, with 39.8 permits being granted each day for the mobilization of 1,254 heads of cattle – i.e. 31.5 animals per permit. In San Luis Potosí and Durango, the two most important markets, 16.4 and 27.1 permits per day were issued respectively. Finally, the market with the most interstate mobilization at the national level was Querétaro with 35.0 % of all the cattle mobilized for slaughter, followed by Durango with 18.7 % of all cattle mobilized for slaughter and Jalisco with 17.5 %.
Demand
Only 20.7 % of the 2,446 municipalities, and 100 % of the state-level markets, required cattle for slaughter in Mexico. Demand was very uneven, with 88.4 % of all cattle destined for slaughter being concentrated in a mere 3.0 % of all the municipal markets. The most important municipal markets were Tamuín in the state of San Luis Potosí and Vista Hermosa in the state of Michoacán, with respective concentrations of 13.6 % and 10.8 % of all the cattle destined for slaughter. Other important markets were Culiacán in the state of Sinaloa (9.0 %), Tlahualilo in the state of Durango (8.4 %) and Mexicali in the state of Baja California Norte (8.0 %). For the Tamuín, Tlahualilo and Mexicali markets, 95.0 % of all trade occurred at the intrastate level, while the figure for the other markets mentioned was lower (72.4 %).
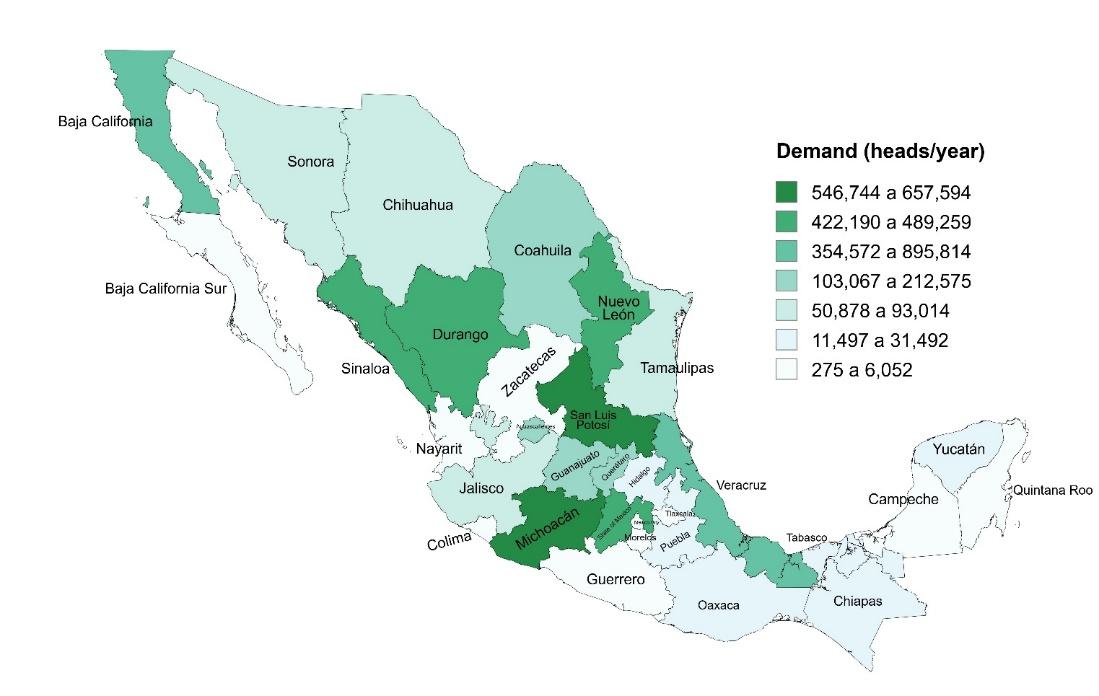
Just as in the state supply markets, it was possible, based on the state demand for cows for slaughter, to split the 32 states into seven strata, two of which were characterized by high concentration levels. Of the 32 state-level markets, 31.8 % accounted for 86.3 % of all the mobilized cattle. The most important state markets were located in the north and center of the country: San Luis Potosí (13.8 %), Michoacán (11.4 %) and Durango (10.2 %). Intrastate mobilization constituted 90.0 % of all intrastate movement of cattle in San Luis Potosí and Durango, and 65.0 % of all such movement in Michoacán (Figure 2).
Figure 2: Average annual state demand in Mexico for cattle for slaughter, 2017-2021
In addition to the variables that made up the structure and dynamics of the interstate supply of cattle for slaughter in Mexico, the trade deficit was added to the demand. The said deficit constituted 18.5 % of all the cattle mobilized for slaughter, 49.6 % of which were moved to the State of Mexico, 21.5 % to state of Michoacán and 8.2 % to state of Sinaloa. These states accounted for 96.8 %, 34.7 %, and 16.2 % of the national demand respectively. Since 35.0 % of the national deficit was covered by the state of Querétaro market, 18.7 % by the state of Durango market, and 17.5 % by the state of Jalisco market, the most dynamic demand state markets were Querétaro with 37.4 cattle-mobilization permits for 41.8 heads of cattle per permit, while state of Michoacán issued 33.1 permits and 78.0 heads of cattle per permit.
The interstate market mobilized equal amounts of male and female cattle, but the preference was different, with 50.9 % of the mobilization permits being exclusively for male animals, 25.45 % for both male and female animals, and 23.7 % exclusively for female animals. Of the male cattle, 16.3 % came from Querétaro, 14.6 % from San Luis Potosí, and 14.2 % from Durango, while 21.7 % of the female animals came from Nuevo León, 12.6 % from Durango, and 10.4 % from Coahuila; 17.2 % of both male and female animals came from Baja California, 16.6 % from San Luis Potosí, and 13.6 % from Durango. On average, 54.1 % female cattle were mobilized per permit, 44.2 % male animals per permit, and 33.9 % both male and female cattle.
Networks
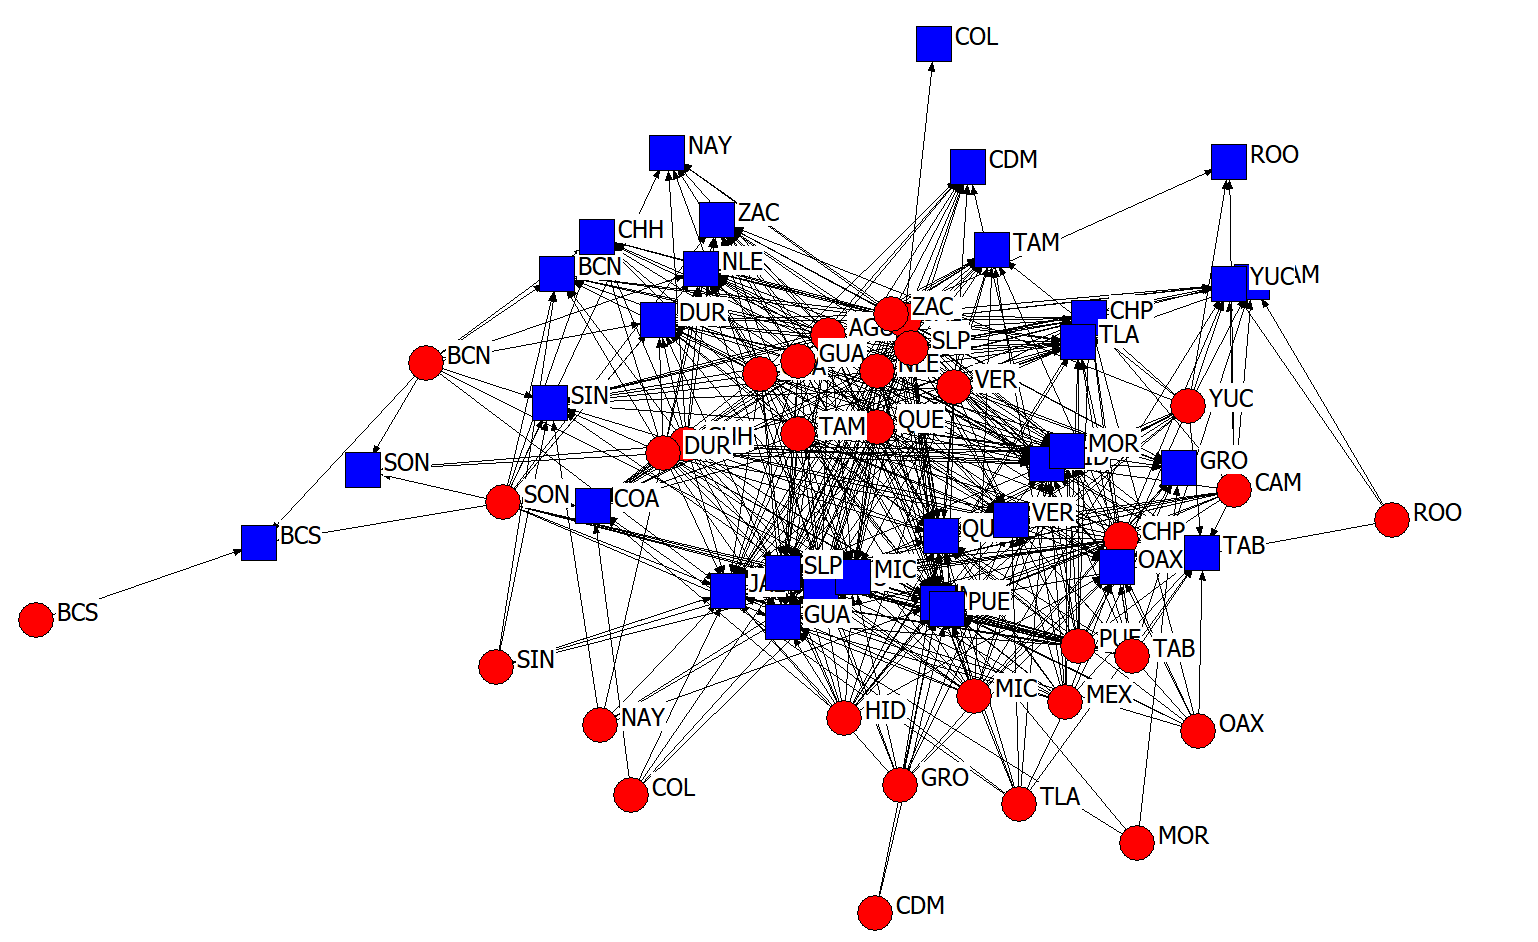
Figure 3 shows the interstate connections between the source markets (red circle) and the destination markets (blue square) pertaining to cattle for slaughter. The bigger the supply (source) and the demand (destination), the bigger the resulting network with the markets with the highest degree of centrality located in the center of the network, which was complete between 2017 and 2019, and incomplete between 2020 and 2021, when the Baja California Sur (BCS) market split off from the national network. The communication of information with a high level of homophily was continuous at 77.4 % of nodes, and it can also be seen that Sonora (SON) and Baja California Norte (BCN) served as the links between BCS and the national market.
Figure 3: Interstate distribution network in Mexico of cattle for slaughter 2017-2021
Aguascalientes (AGU), Baja California Norte (BCN), Baja California Sur (BCS), Campeche (CAM), Chiapas (CHP), Chihuahua (CHH), Ciudad de México (CDM), Coahuila (COA), Colima (COL), Durango (DUR), Estado de México (MEX), Guanajuato (GUA), Guerrero (GRO), Hidalgo (HID), Jalisco (JAL), Michoacán (MIC), Morelos (MOR), Nayarit (NAY), Nuevo León (NLE), Oaxaca (OAX), Puebla (PUE), Querétaro (QUE), Quintana Roo (ROO), Sinaloa (SIN), Sonora (SON), Tabasco (TAB), Tamaulipas (TAM), Tlaxcala (TLA), Veracruz (VER), VI (San Luis Potosí (SLP), Yucatán (YUC), Zacatecas (ZAC).
While the average annual density of the national cattle-for-slaughter network was low (34.2 %), an 8.0 % decrease in density was observed, from 36.9 % in 2017 to 31.0 % in 2021, showing a direct relationship between possible markets and feasible markets. Furthermore, the low standard deviation indicates that sources and destinations maintained their market preferences (i.e. homophily).
In-degree and out-degree centrality was low (32.7 %), confirming the homophily existing in the cattle-for-slaughter market. In terms of supply, Jalisco’s market had the highest centrality (78.1 %), supplying cattle to 77.5 % of the 32 national markets; Zacatecas with 69.4 %, and Querétaro with 61.3 %, linked up with 68.8 % and 60.3 % of the national markets respectively. The three least centralized markets were Morelos, Quintana Roo and Baja California, which respectively linked up with 7.0 %, 3.1 % and 2.5 % of the national markets.
With regard to demand, average output density was low, and average input density was even lower, but with less homophily (10.1 ± 5.8 %). The State of Mexico market was the most central one (74.4 %), requiring cattle from 76.3 % of the state-level markets, while Aguascalientes and Querétaro required cattle from 63.8 % and 64.4 % of the state-level markets respectively. At the other extreme were the markets of Mexico City (output) and Colima (input), with the lowest level of influence (1.3 % and 3.8 % respectively).
Another indicator of centrality that measures the prestige of markets within the network is eigenvalue or characteristic value. The prestige of the national cattle-for-slaughter market was low (17.0 %) and stable (6.0 %). The markets with the highest levels of prestige were Jalisco (24.0 %), Zacatecas (23.0 %), and the State of Mexico (23.0 %), while those with the least influence were Colima (5.0 %), Quintana Roo (3.0 %), and Baja California Sur (1.0 %).
Municipal market network
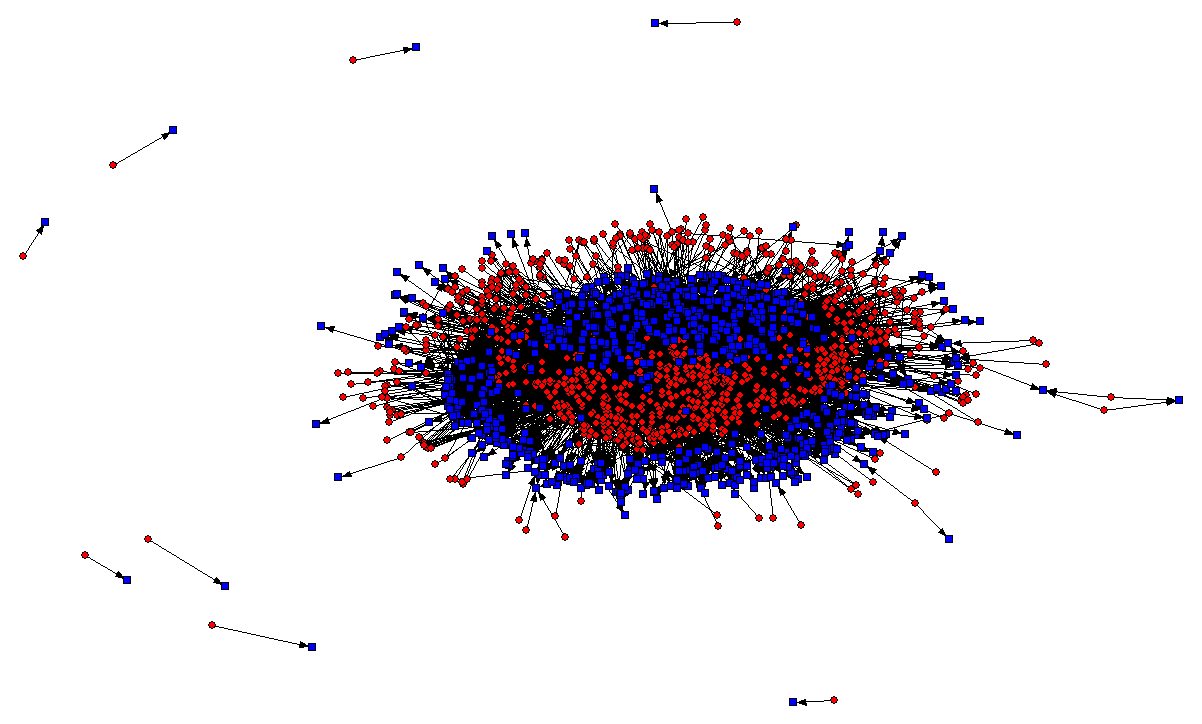
The municipal supply network pertaining to cattle for slaughter was composed of 1,013 municipalities (41.4 % of all the municipalities in Mexico), while the municipal demand network was composed of 890 municipalities (36.4 % of all the municipalities in Mexico). It was an incomplete network, with eight markets being disconnected from the national network (Figure 4).
Figure 4: Municipal network pertaining to the mobilization in Mexico of cattle for slaughter 2017-2021
A high level of concentration was observed in the network. With 10 markets supplying 64.7 % of all the cattle for slaughter, the most important of which were Tamuín in San Luis Potosí (13.5 %), Tlahualilo in Durango (10.6 %), and Mexicali in Baja California (7.7 %); all characterized by an intensive meat-production system. While 68.4 % of all demand was concentrated in 10 municipalities, the most important of which were Tamuín in San Luis Potosí (13.6 %), Vista Hermosa in Michoacán (10.8 %) and Culiacán in Sinaloa (9.0 %).
The density of the national network of municipal markets was very low, with only 4,694 of 342, 421 markets being effective. Average exit density (0.98 %) was lower than average entry density (1.2 %), but not different (P<0.05). The most prestigious municipal markets were Ezequiel Montes in Querétaro and La Paz in State of Mexico.
Average municipal out-degree centrality was low (9.6 ± 15 %), with the most central municipal output markets being Ezequiel Montes in Querétaro (20.2 %), Tepatitlán de Morelos in Jalisco (14.6 %) and San Juan de Los Lagos in Jalisco (12.8 %). In-degree centrality was greater than output density (11.9 ± 23.2 markets), with the most central entry market being La Paz in State of Mexico with 301 effective markets of 1,013 possible markets. Other important destination markets were Ezequiel Montes in Querétaro (23.8 %) and Aguascalientes in Aguascalientes (20.3 %). Moreover, both annual out-degree and in-degree centrality remained unchanged, showing no significant differences in average centrality over the years (P>0.05).
Discussion
The analysis reveals the official situation of SENASICA with regard to the flow of cattle for slaughter in Mexico between 2017 and 2021. Veracruz and Jalisco are the most important states(3,21,22). The findings show that San Luis Potosí and Durango had the first and second highest levels of supply respectively, while San Luís Potosí and Michoacán had the first and second highest levels of demand respectively, with Veracruz having the fourth highest level of supply and the eighth highest level of demand. Furthermore, it is the municipal markets that are significant, rather than the state-level ones. The most important supply municipalities were determined to be Tamuín in San Luis Potosí and Tlahualilo in Durango, while the most important demand municipalities were found to be Tamuín in San Luis Potosí and Vista Hermosa in Michoacán.
The analysis of market location shows that the markets remitting and receiving the smallest amounts of heads of cattle are the most specialized ones, due to the fact that they have the smallest share of the national herd and their interstate trade is in finished cattle. Furthermore, they have the lowest prices for cattle on the hoof and send their cull cows and bulls to local slaughterhouses.
In contrast, the lowest levels of specialization were found in the states with the biggest stocks, due to the proportions of cull animals and slaughterhouses. The largest inventories were recorded in Veracruz (13.5 %) and Jalisco (9.2 %), while the smallest inventory was recorded in nine states, which had a total of 3.2 % of the national herd(3).
The findings regarding market specialization coincide with those of Callejas and Rebollar(5), who report that 50.5 % of the cattle slaughtered in Mexico are steers and heifers killed for meat, while 34.8 % of all slaughtered cattle are cull cows and 13.8 % are cull bulls. Moreover, Callejas(2) found that 42.7 % of all beef cattle are sent to the most specialized markets – i.e. Tamuín in San Luís Potosí (15.2 %), Mexicali in Baja California (10.5 %), Durango (8.9 %), and Ezequiel Montes in Querétaro (8.1 %).
On the other hand, high concentration and intrastate trade are subject to variables such as pre-slaughter stress(23), low yield and financial loss(24), and disease reduction(25), although Hultgren et al(16) found no significant differences, in terms of animal welfare, between killing cattle in local slaughterhouses and killing them in mobile slaughterhouses.
The larger size of the intrastate market was due to the fact that the destination of mobilized cattle is associated with the installed capacity of the slaughterhouses. Mexico’s slaughterhouses have a total monthly installed slaughtering capacity of 1’267,995 heads of cattle and a used capacity of 52 %, added to which demand efficiency in the ten main cattle-for-slaughter states was 64.4 %(3).
The slaughterhouses located in San Luis Potosí have an annual installed slaughtering capacity of 1.2 million heads of cattle, but the average annual demand was for only 52.8 % of that capacity, while only 51.9 % of installed capacity was found in the state of Michoacán. Callejas et al(4) found that cattle slaughterhouses have an average efficiency level of 54.0 % of installed capacity, while the only slaughterhouses in Chiapas with 100 % efficiency were private ones. The “slaughterhouse”, “price” and “distance-from-source-to-destination” variables explain why there is more intra-municipal trade than inter-municipal trade.
Moreover, a significant association between the number of entering trade connections and the price of cattle on the hoof(26). Examination of a sample of prices of beef on the hoof from cows, bulls, bullocks and heifers in 20 municipal, ‘federal-inspection-type’ and private slaughterhouses during the period studied reveals that the average price was MXN$40.75 ± 6.82/kg. The highest price (MXN$54.90/kg) was paid in San Luis Potosí, and the lowest price (MXN$30.96/kg) in Campeche. These price differences represent opportunity costs, with San Luis Potosí being a small, specialized market, while Campeche is a big market with a low level of specialization.
The average opportunity cost in Mexico’s cattle-for-slaughter market was MXN$14.58 ± 5.66/kg. In Campeche it was MXN $23.94/kg, although, even if the cost of mobilization had been added to this, a bigger profit would have been obtained if the cattle in question had been sold in San Luis Potosí. The second-best option was the State of Mexico, which had an opportunity cost of MXN$1.63/kg as against San Luis Potosí.
The density of the network pertaining to Mexico’s cattle-for slaughter market shows that all the country’s markets are interconnected, but with a low level of density that is directly related to slaughterhouse availability in the main productive municipalities, which makes the latter the main consumers. However, the high degree of concentration shows that market structure is determined by the amount of cattle mobilized for slaughter. The low degree of density also gives rise to ―and conditions― the high level of homophily. Only five of the 32 markets had no intra-municipal trade, it being no coincidence that they were the smallest ones, so that 7.7 of every 10 cattle mobilizations had the same source and destination.
The low level of network centrality reveals a disperse market. Although Jalisco has more destination markets and the State of Mexico has more source markets, they both have low participation in the source and destination markets. Both the aforesaid markets share 68.8 % of all the markets, having weak links with the two most important ones. Although Jalisco shows a profit, it mainly slaughters cull cattle, while the State of Mexico has a deficit and slaughters finished cattle. Hence, the Jalisco market occupies the centermost position in the network, with its strength residing in the fact that it has the highest number of slaughterhouses in the country.
Conclusions and implications
Social-network analysis offers an alternative way to study the cattle-for-slaughter market. The structure of Mexico’s cattle-for-slaughter market is characterized by a high level of intra-municipal trade resulting from an important municipal supply of slaughterhouses with low used capacity, while intrastate trade is mainly due to the State of Mexico’s large deficit. Therefore, Mexico’s national cattle-for-slaughter network is complete and with a high level of homophily, but with low levels of density and centrality.
Literature cited: