https://doi.org/10.22319/rmcp.v16i1.6669
Technical note
Preliminary analysis of the development of a breeding program of the Peruvian Paso horse in field conditions
Jorge Luis Vilela Velarde a*
Paola Giovanna María Quintana Dolores a
María Lourdes Velarde Marcos a
Teresa Vargas Rodríguez a
Rosario Gonzales Lecaros a
José Dextre Chacón a
a Universidad Científica del Sur. Facultad de Ciencias Veterinarias y Biológicas. Carrera de Medicina Veterinaria y Zootecnia. Grupo de Investigación en Ciencia Equina y Animales Autóctonos. Lima, Perú.
*Corresponding author: jvilela@cientifica.edu.pe
Abstract:
The genetic parameters of overreach, term and acuteness in Peruvian Paso horses (PPH) have not been determined to date. It is important to estimate these parameters for application in PPH breeding, therefore, the aim of this study was to estimate the heritability, repeatability, and genetic correlations in field conditions of overreach, term, and acuteness of PPH. The study included 134, 137 and 134 stallion and mare records for the traits overreach, term and acuteness, respectively. All measurements were recorded in MP4 video format with a resolution of 1,920 x 1,080 megapixels and at 60 frames per second. All traits were measured three to five times (once per stride), and each trait was analyzed. KINOVEA software version 0.9.5 was used to analyze the measurements. A multivariate repeated measures animal model with sex effect was used to estimate the variance components for each trait using WOMBAT software. The results showed heritability of 0.411, 0.476 and 0.405, for the traits of overreach, term, and acuteness, respectively. Repeatability was high in all traits (> 0.70). Genetic additive correlations ranged from -0.30 to 0.49. It can be concluded that overreach and term have high heritability values, which allows these traits to respond better in a selection process, unlike acuteness, which has a moderate heritability value.
Keywords: Heritability, Genetic correlations, Repeatability, Overreach, Term, Acuteness.
Received: 03/04/02024
Accepted: 23/10/2024
The Peruvian Paso horse (PPH) is an equine breed native to Peru. Since 1947 the National Association of Breeders and Owners of Peruvian Paso Horses (ANCPCPP) of Peru has made great efforts in the conservation, breeding and selection of this breed(1). This breed is considered a gaited horse with a symmetrical four-beat rhythm and lateral footfall sequence during the paso llano gait(2-4). The ANCPCPP(5) defines the paso llano as when the horse breaks the ambling gait on the sides into 4 steps. Other breeds have similar gaits, although with some differences, including the classic Fino, the curly rack, the coon rack, the fox trot, the marcha picada, the mountain pleasure rack, the rocky mountain rack, the road gait, the sobreandando and the toelt(4). In PPH, the smoothness and harmony of the movement arises from the combination of execution modalities during the paso llano (or “ambladura rota”)(2). The main traits involved are term, acuteness(6-9) and overreach(10-13) (Figure 1). More optimal values of these three traits used as part of the criteria to evaluate the performance of each animal are desired. These traits were selected because they directly influence the smoothness, harmony and efficiency of the horse's movement, resulting in a smooth gait(7), which is the characteristic that distinguishes this breed from others in the world and is of utmost importance in horse selection by breeders. The evaluation of these characteristics during movement allows identifying animals with the most favorable movements and, therefore, with greater potential to be used in genetic improvement programs. When evaluating horses, the measurement of traits by the human eye can be challenging, due to subjectivity and limited precision(9,14). Several studies on equine sports medicine have focused on kinematics in horses, identifying changes in athletic performance and health(8,15,16). To measure the functional traits of a horse, it is recommended to estimate objectively measurable kinematic variables(17). Therefore, the aim of this study was to estimate the heritability, repeatability, and genetic correlations in field conditions of overreach, term, and acuteness in PPH.
In order to achieve the proposed objectives, 140 animals were phenotyped, and of these, only records that could be analyzed were used. Records not considered in the analysis were discarded due to recording problems related to the video recorder lens. Horses that did not move parallel to the camera, that limped, had a very slow speed, handler blocking camera view or mares with foals at their sides during the gait that prevented the identification of the marks during the paso llano, were not included in the study after debugging the videos. Finally, the records of 134, 137, and 134 animals, with a higher proportion of females than males (80 % and 20 %, approximately), were used to study the traits of overreach, term, and acuteness, respectively. The mean age of the horses was 7.67 ± 2.61 yr, ranging from 5 to 11 yr (median 7.05 yr). The same animals were used for the analysis of the three traits. In accordance with each trait (overreach, term and acuteness), a total of 1,615, 1,641 and 1,615 individuals, respectively, that could be traced back 21 generations, were included in the database. Information related to pedigree analysis, including the number of animals traced, related phenotypes and inbreeding coefficients, are presented in Table 1. The generational interval of the entire population tracked was 8.76 ± 4.53 yr. This study was approved by institutional Committee of Ethics in Research with Animals and Biodiversity of the Universidad Cientifica del Sur (Cod. 028-2021-PRO99) and permission was obtained from the owners of the animals for data collection. Only healthy animals, examined by a registered veterinarian, with no signs of lameness in one or more legs, were included in the study.
Table 1: Pedigree structure for each trait
All animals were evaluated in their breeding facilities. These consisted of a flat, dry, unobstructed grassy fields. Start and end points were determined, which were perpendicular to the location of the camera lens, through which each animal moved during the recording of overreach and acuteness. During the recording each horse travelled a straight distance of 50 m from a start to a finish point located in front of the camera lens. Each horse was evaluated on different days, with groups of three to ten horses assessed per day, depending on the availability of the breeders. Each breeder used an experienced handler to record the video recordings.
To identify the reference points for measuring each trait, a 4 x 4 cm tape was attached to the areas marked in Figure 1. All measurements were recorded in video MP4 format with a resolution of 1,920 X 1,080 megapixels and at 60 frames/sec(18). The animals were placed on a flat surface and were pulled by an operator at a paso llano with an approximate speed of between 2.5 and 4 m/sec, covering 50 m. The performance of the horse was recorded by filming with video camera on a tripod with a fixed position positioned horizontally (confirmed with a level) at a height of 1.3 m and 12 m from the middle of the line of motion, recording the movement of each animal laterally. All traits were measured by three to five technical replicates (once per stride) and were included in the model for analysis. The description of the measurement of each trait is detailed in Figure 1. KINOVEA software version 0.9.5 (http://www.kinovea.org/) was used to analyze the measurements(19).
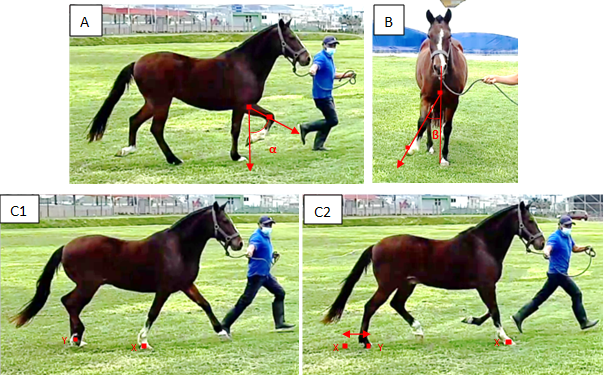
Figure 1: Genetic parameters of overreach, term and acuteness in Peruvian Paso horses
Acuteness (A): representation of the maximum α angle of the acuteness of the right forelimb measured from the orientation connecting the knee to the elbow with respect to the vertical, in the sagittal plane (9). Term (B): representation of the maximum β angle of the term of the right forelimb measured from the lateral hoof wall with respect to the vertical in the coronal plane of the horse (9). Overreach (C1 and C2): representation of overreach, measured as the distance between X and Y, where X is the footfall of the right forelimb hoof position during maximum protraction and retraction onto the ground and Y is the footfall of the right hind limb hoof position during maximum protraction and retraction onto the ground when X is
For statistical analysis, all the traits were subjected to descriptive statistical analysis and normality analysis using the Anderson Darling test with P>0.05 indicating that the trait met the normal distribution. JASP software was used for these analyses. Heritability is expressed by h2=a2p2, where a2 is the additive genetic variance, and p2 is the phenotypic variance(20). The phenotypic records of three traits were fitted to the repeated measures multivariate animal model with a fixed sex effect to estimate the variance components of each of the three traits using the average information (AI) algorithm for restricted maximum likelihood(21). WOMBAT software was used for all procedures (http://didgeridoo.une.edu.au/km/wombat.php)(22). The model used is expressed as:
Yijk=μ+Sexi+Animalj+Horsek+ eijk,
Being
Yij the phenotypic value for each trait;
µ the population mean;
Sexi the fixed effect of sex (2 levels);
Animalj the random effect of the jth animal ~ND0,Aa2, A denotes the numerator relationship matrix among animals and a2 the additive variance;
Horsek is the random effect of the kth measure of the individual (3 to 5 levels) ~ND0,Ipe2, where I is the identity matrix, pe2 is the permanent environment variance;
eijk the residual random effect~ND0,Ie2.
The pedigree structure was used for the estimation of additive variances and covariances of the random effect for the calculation of heritability, repeatability and genetic correlations.
Repeatability can be estimated as the proportion of the phenotypic variance explained by the additive variance and the permanent environmental variance(20). Nonadditive contributions to consistent among-individual differences are normally referred to as “permanent environment effects”. If a trait has repeated measures, then it is necessary to model permanent environment effects in an animal model to prevent upward bias in additive variance(22). Therefore, among-individual variance is given by the Animalj component, while the residual component represents within-individual variance(22). For calculation of repeatability, three records (3 levels) per animal per trait were used to estimate these variance components. Repeatability (R) was calculated from: R= a2+ pe2a2+ pe2+ e2 . Phenotypic and additive genetic correlations were calculated with the same records used for the heritability calculations. All traits were subjected to the Anderson-Darling normality test and showed normal distribution with a significance value of P>0.05 for all traits; therefore, the use of the proposed animal model is appropriate.
According to the results, overreach was found to have high(23) heritability, in line with the findings of Molina et al(24) for stride length. In contrast, Sole et al(10) reported an overreach heritability in the Lusitano horse that was considerably lower than observation in this study . In addition, it was observed that overreach in this study significantly differed from that reported in other studies, particularly in the trot gait(10). However, some studies(12,13) reported positive overreaches in Andalusian horses. The heritability of term, also proved to be high. Regarding acuteness, its high heritability was similar to that found in Lusitano horses(10), albeit for a related, yet different, trait. The discrepancy in results compared to Molina et al(24) could be attributed to factors, such as the horse's training level(25) and the omission of the sex effect in their study, since they only assessed males.
As could be observed, the heritability values of all the traits analyzed were high (greater than 0.40). These values can be explained by the non-inclusion of an external factor that allows free gait of the horse, such as a rider that can alter the rhythm and movement of the animal during the flat gait(26). These movements are performed freely and are more homogeneous without the external effect and are therefore more heritable(27). Another reason that might explain the high heritability values is that there may have been more specialization in PPH contests(27), or better use of the selection process in the breed(23), although it may also be because this population was more homogeneous due to the higher number of mares (~80 %) analyzed in this study and only adult animals (5 to 11 yr old) were included(27). One way to achieve greater genetic progress may be with higher selection intensity, as well as higher heritability values(28). Furthermore, it should also be taken into account that improvement in these traits is the result of a complex combination of conformational, physiological and behavioral traits(29). Efficiency in genetic selection for bio-kinematic variables can be more efficient than selection based on animal performance, and this can be translated into higher heritability values(30).
As a criterion for categorizing correlations, the Quinnipiac University scale(31) was used to classify correlations less than or equal to 0.20 as weak, greater than 20 and less than 0.40 as moderate and greater than 0.40 as strong(27,32,33). The additive genetic correlations found in the present study ranked between absolute values of 0.301 (standard error= 0.432) and 0.697 (standard error= 0.374), similar to other studies conducted under field conditions(30), and the phenotypic correlations ranked between absolute values of 0.183 (standard error= 0.081) and 0.213 (standard error= 0.079). Although it is true that genetic correlations provide information about the relationship between traits, they are not always as useful as phenotypic correlations at the time of evaluation during performance(32) possibly due to training time at the time of the assessment, rider experience or other environmental factors. Their main utility can be applied to the construction of selection indices or to predict correlated response to selection(34).
Regarding repeatability values, these were greater than 0.70 for all the traits, which is considered excellent(35). Similar results in kinematic traits were found in trained dressage and bullfighting horses (over 0.50), and in Swedish Warmblood horses in scored gaits with values between 0.75 and 0.77(36). The low standard error values close to 0.02 indicate high precision in all traits (0.898, 0.842 and 0.901 for overreach, term and acuteness, respectively), indicating that this parameter has little effect on the temporal environment of the three traits(20). This can also be corroborated by the c2 values obtained in this study, with values ranging from moderate to high, indicating that a considerable proportion of the phenotypic variance is explained by additive variance and permanent environmental variance, rather than temporal environmental variance(20), although this is not concise with the term trait, which may be mainly affected by the additive genetic effect. Taking into account the methodology of Sepulveda et al(35), who found higher repeatability values in daily than in weekly observations, it can be suggested that observations made with minute differences could be even higher, as found in this study. This can be corroborated in a study conducted in horses of different breeds(37) in which the repeatability of head and pelvis position asymmetry presented values between 0.89 and 0.95. Furthermore, these results corroborate that trait with high repeatability require few measurements (3 in this study) to obtain higher precision, and an increase in the number of measurements may be irrelevant for parameter estimation. Taking into account the high repeatability values found, this parameter can be used as an indicator of how effective the selection process can be, considering its relationship with heritability, due to the inclusion of permanent environmental variance (within-individual variance) in its estimation(20,38).
This research presents several positive findings, with promising heritability values indicating that overreach, term and acuteness have high potential for improvement in a selection plan. The positive genetic correlations found between overreach and acuteness suggest that both traits can be improved simultaneously through specific breeding strategies. Furthermore, high repeatability values with high precision indicate that the number of measurements required for these traits can be reduced, simplifying the evaluation process.
However, certain limitations in the study. The overall accuracy of the traits was somewhat limited, probably due to the small sample size. The complexity of performing kinematic measurements and the time required to travel between different breeding centers were the main reasons for this limitation. However, despite the small number of animals phenotyped, the estimation of genetic parameters is justified as preliminary values and are useful for later references, as has been observed in other studies with similar sample sizes (100 to 362)(29). The population of animals included in this study was small, but the average total inbreeding coefficient (~5.43 %) was comparable to the studies of Larrea et al(39) and Montenegro et al(40) (5.97 % and 5.44 %, respectively). This suggests that the results obtained can be interpreted as a reference for the general population of PPH. All horses were tested with the same device under field conditions, ensuring that any potential bias was consistent across subjects.
In conclusion, findings of this study provide a valuable reference for the genetic improvement of PPH, despite the noted limitations. The results indicate that traits, such as overreach, term and acuteness, exhibit high heritability and can be effectively targeted in breeding programs. The preliminary genetic parameters of the study and the comparability of inbreeding coefficients with other research support the relevance and applicability of this results.
Conflicts of interest
The authors state that records of eight animals owned by José Dextre were used. It is also stated that José Dextre was Chairman of the Board of the Universidad Científica del Sur during the development of the methodological phase of this research.
Annex 1: Descriptive statistics per trait
CI= confidence interval.
Annex 2: Estimates of heritability (h2), ratio of the permanent environment variance to phenotype variance (c2) and repeatability (R) (on diagonal), phenotypic correlations (bellow diagonal) and additive genetic correlations (above diagonal)
Standard error in brackets.
Literature cited: