https://doi.org/10.22319/rmcp.v16i1.6648
Article
Multitrait analysis of growth traits for the optimization of breeding value prediction in Braunvieh cattle
Mohammad Ali Nilforooshan a
Agustín Ruíz-Flores b
Paulino Pérez-Rodríguez c
Thierry Pabiou d
Luis Antonio Saavedra-Jiménez e
Jonathan Emanuel Valerio-Hernández f*
a Livestock Improvement Corporation, Research & Development Division, Hamilton 3240, Waikato, New Zealand.
b Universidad Autónoma Chapingo. Posgrado en Producción Animal. Estado de México, México.
c Colegio de Postgraduados. Socio Economía Estadística e Informática. Estado de México, México.
d The Irish Cattle Breeding Federation. Link road, Ballingcollig, Co. Cork, Ireland.
e Universidad Autónoma de Guerrero. Facultad de Medicina Veterinaria y Zootecnia No. 2. Guerrero, México.
f Universidad Nacional Autónoma de México. Facultad de Medicina Veterinaria y Zootecnia. Ciudad de México, México.
*Corresponding author: jevh_93@hotmail.com
Abstract:
Currently, the genetic evaluations of growth traits (birth weight (BW), weaning weight (WW), and yearling weight (YW)) for the Mexican Braunvieh cattle are carried out in a univariate (for BW) and a bivariate (for WW and YW) models. Precision of genetic evaluations can be improved by a trivariate model. It was aimed to study bias in the univariate and bivariate evaluations due to the missing trait(s) in the analysis and the accuracy gain by the trivariate analysis. Pedigree and performance data were obtained from the Asociación Mexicana de Criadores de Ganado Suizo de Registro. After data edits, univariate, bivariate, and trivariate analyses were performed to make comparisons. A simple data pruning strategy was employed, considerably reducing the data size in the analyses. Animals excluded from the analyses were evaluated at a low computational cost from solutions of animals included in the analyses. The bivariate analysis showed biased WW and YW evaluations and genetic trends. The genetic trends underestimated young animals. Since the mid-1990s, all the traits showed a steady genetic progress. The bias was due to natural/artificial preselection on BW. The inclusion of BW in the trivariate analysis helped to consider the preselection information. The univariate BW evaluation and genetic trend were unbiased. Also, BW gained less accuracy from WW and YW than WW and YW from BW. Based on the results of this study, it is recommended the trivariate analysis of the traits with data pruning to lower the computational cost.
Keywords: Accuracy, Animal model, Bias, Breeding value, Braunvieh, Multitrait, Preselection, Pruning, Univariate.
Received: 20/02/2024
Accepted: 07/11/2024
Introduction
The European Brown Swiss cattle was introduced to Mexico in the mid-19th century(1,2). In 1967, the Asociación Mexicana de Criadores de Ganado Suizo de Registro (AMSGSR) was established, and in 1968, both dairy (American Brown Swiss) and dual-purpose (European Brown Swiss or Braunvieh) variants were registered(3). The potentials of the breed, such as good fertility, hardiness, adaptability, and dairy and meat production, have positioned this breed as one of the favorite breeds to cross with Zebu in the Mexican tropics production systems. During the last two decades, the Mexican Brauvieh cattle have gradually displaced Bos indicus(4).
The first national genetic evaluation of the Braunvieh breed was carried out in 2003 by AMGSR, with periodic evaluations and genetic trend monitoring since then(5). Currently, birth weight (BW), weaning weight (WW), yearling weight (YW), and scrotal circumference (SC) are evaluated, while the American Brown Swiss also includes milk volume adjusted to 210 d in milk(6). Although Braunvieh breeding has led to genetic gains, the levels of genetic gain were not as expected. Larios-Sarabia et al(7) reported declines in milk production genetic trend in Jersey and American Brown Swiss herds in Mexico, partly due to herds with different selection goals. They raised the need to revisit and restructure the national genetic improvement programs for those dairy populations.
Multitrait genetic evaluations have been very useful in the genetic improvement of animals(8,9). Advantages of these models compared to univariate models have been reported, such as a greater magnitude of the estimated heritabilities(10), reduction of bias introduced by sequential selection(8,11), gain in the accuracy of breeding values(11,12), better estimator properties, especially for incomplete data(9). Compared to univariate models, they better utilize the available information via the correlations among traits. Hence, more accurate evaluations are produced(11). Multitrait evaluations come at a greater computational cost to construct the equation system, solve a large set of equations, and slow convergence (more and slower iterations) due to an increased number of non-zero off-diagonal elements of the coefficient matrix(11).
In multitrait models, phenotypes for one trait serve as phenotypes (with weighted importance) for the other traits. As a result, more breeding values are obtained, such as breeding values for traits measured later in life. For example, a newborn calf will receive breeding values for WW and YW based on its own BW phenotype and relatives’ phenotypes for any of the three traits. Those breeding values are more accurate than the calf’s parent (breeding value) averages for WW and YW.
AMSGSR regularly evaluates BW, WW, YW, and SC, and the genetic evaluation results are communicated to stakeholders and farmers. AMSGSR aims to increase the cattle's productivity, protect the interests of breeders, and promote the breed. Due to the large historical data and limited computational resources, these traits have been evaluated separately in univariate animal models for years. Since 2016, WW and YW have been evaluated with a bivariate animal model. The next step to this improvement might be evaluating the three growth traits together in a single multitrait animal model. That way, WW and YW evaluations get free from (natural/artificial) preselection for BW, and the three traits benefit from the additional information in the analysis.
The aims of this study were 1) to develop a multitrait model for the joint evaluation of BW, WW, and YW for the Mexican Braunvieh population in a constraint computational environment, 2) quantify bias in the current state of genetic evaluation for the growth traits (i.e., a univariate BW and a bivariate WW-YW evaluation), and 3) accuracy gain in analyzing the three traits simultaneously.
Material and methods
Data
Pedigree and performance data were obtained from AMSGSR. For each trait (BW, WW and YW), the herds were required to have a minimum of four performance records. Records from animals born from embryo transfer (due to the lack of identification of the recipient cows) or with both parents unknown were removed. WW phenotypes were limited to those taken in a range of 195 and 285 d of age and then adjusted to a target of 240 d of age. YW phenotypes were limited to those taken in a range of 320 and 410 d of age and then adjusted to a target of 365 d of age. Then, records outside the trait's mean ± 3 SD range were discarded. Phenotypes were also discarded if the age of the dam at the animal’s birth was outside the 20 to 180-mo range. Contemporary groups were defined within trait by the herd (256), year (1901–2020), and season (rainy vs dry) of weighting. Contemporary groups were required to have a minimum size of three animals. Smaller contemporary groups were discarded, and 2,532 contemporary groups gathering 37,738 animals remained.
Data pruning
There were 193,442 animals in the pedigree born until 2020. A simple data pruning strategy was applied by upward pedigree extraction from animals with phenotype in at least one of the three traits (37,738). The extracted pedigree subset from those 37,738 animals contained 64,501 animals born from 1950 to 2020. This is expected to have a considerable effect on reducing computational time and demands. The excluded animals had no phenotype contribution. Breeding values and their accuracies (EBV and r) of the animals excluded from the analyses were estimated iteratively from parents’ information (EBVprogeny = (EBVsire + EBVdam)/2 and rprogeny=0.5×rsire2+rdam2). The iterative procedure was:
Calculate breeding values and accuracies for animals with both parents (if known) in the pedigree subset, based on parents’ breeding values and accuracies.
Append the pedigree rows for those animals to the pedigree subset.
Repeat steps 1 and 2 while there are animals to be added to the pedigree subset.
The pedigree subset contained 21,405 males, 43,096 females, 3,321 sires, and 29,700 dams. Breeding values and accuracies of 171,390 animals were calculated using the above iterative procedure. The 22,052 remaining animals were in pedigree trees that received no phenotype contribution. Those animals were not considered in the study. Regardless of the analysis, those receive a breeding value and an accuracy of 0.
The analyses were performed on a t2.medium AWS (Amazon Web Services) Ubuntu 20.04 LTS server with two CPUs and 4 GB of RAM.
Analyses
Following the current practice at AMGSR, BW was analyzed in a univariate model, and WW and YW in a bivariate model:
yBW=XBWbBW+ZBWuBW+eBW,
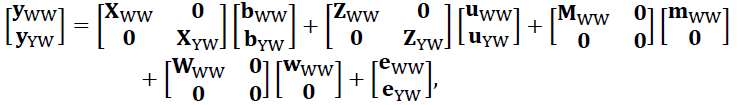
where, y, b, u, m, w, and e are the vectors of phenotypes, fixed effects, direct genetic effect, maternal genetic effect, maternal permanent environmental effect, and residuals. Matrices X and Z relate phenotypes to fixed effects and animals, respectively. Matrices M and W relate phenotypes to dams. To Analyze all three traits jointly, the following model was used:
The variance component structures were:
V(e) = I⊗R, and V(wWW) = Iw2. A is the (pedigree-based) numerator relationship matrix, and R is the trait × trait residual covariance matrix.
Fixed class effects of sex (all traits), milk feeding regimen (3 levels – WW only), post-weaning feed regime (3 levels – YW only), and contemporary group (all traits), as well as fixed regression effects of age of dam at birth (aod), aod2, and percentage of Braunvieh purity, were included in the models. These effects are described in a previous study(13). The purity covariate had a minimum, mean, and median of 0.880, 0.996, and 1, respectively. Only 10.7 % and 1.9 % of data rows had a purity less than 0.99 and 0.95, respectively.
The BLUPF90 family of programs(14) was used for the data analysis, including variance components estimation using the expectation–maximization to compute REML estimates (EM-REML) with acceleration, breeding value, and accuracy prediction. Schaeffer(11) explained the building of mixed model equations and the theory of multitrait animal models well.
Results and discussion
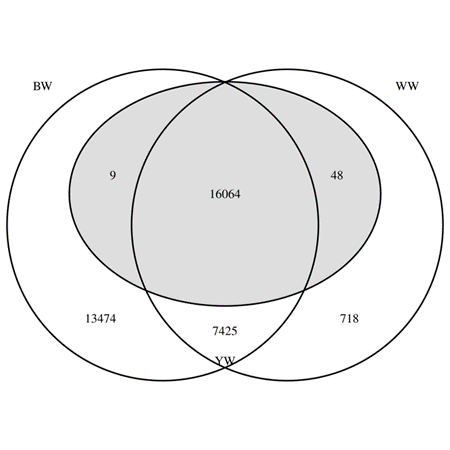
Figure 1 shows the Venn diagram for the number of animals with different combinations of available phenotypes. Among the 37,738 phenotyped animals kept for the analyses, 16,064 had phenotypes for all the traits, and 13,474 had phenotypes for only BW. Of the 16,121 animals phenotyped for YW, 48 were missing BW phenotype, 9 were missing WW phenotype, and none were missing both BW and WW phenotypes (Figure 1). Table 1 describes the phenotype data used in the analyses.
Figure 1: Number of animals with available phenotypes in different combinations of traits
(BW= birth weight (left circle), WW= weaning weight (right circle), YW= yearling weight (middle grey
oval).
Table 1: Descriptive statistics of the phenotypes used in the study
BW= birth weight, WW= weaning weight, YW= yearling weight.
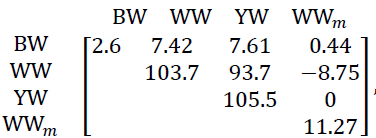
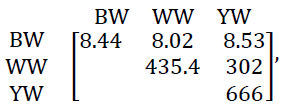
Heritabilities were estimated as h2=u2u2+m2+w2+e2, where u2, m2, w2, and e2 are the estimated variance components associated with the vectors u, m, w, and e, respectively. Where any of these effects are absent in the model, the corresponding variance equals 0. Heritability estimates from the trivariate model were similar to those from the univariate and bivariate models (Table 2). For WW, hm2=m2u2+m2+w2+e2 decreased from the bivariate (0.021 ± 0.009) to the trivariate analysis (0.020 ± 0.008). From the univariate/bivariate analyses to the trivariate analysis, the genetic covariances changed from
to
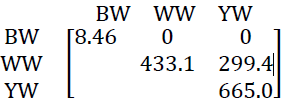
and the residual covariances changed from
to
where WWm is WW’s maternal genetic effect. The changes in the genetic and residual correlations were small. WW’s maternal permanent environment variance changed from 7.34 to 6.84 from the bivariate to the trivariate model.
Table 2: Estimated heritabilities from different analyses and traits
1 Univariate for BW and bivariate for WW and YW.
BW= birth weight, WW= weaning weight, YW= yearling weight.
Unlike the univariate and bivariate models, the trivariate model considers genetic and residual correlations between BW and the two other traits. It is based on the assumption that BW phenotypes may contribute to better genetic evaluations of WW and YW and vice versa. Also, if there is natural or artificial selection on BW, the trivariate model can remove that preselection bias from WW and YW genetic evaluations. Another important feature of the trivariate model is that it provides the first estimates of WW and YW genetic merits for newborn calves.
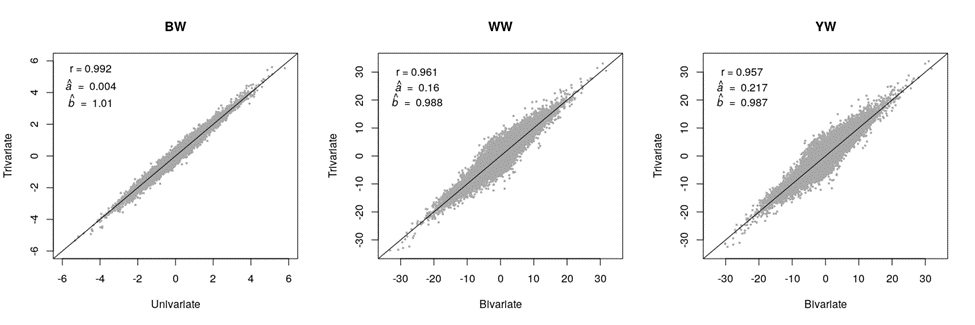
Figure 2 shows the scatter plot of the univariate/bivariate vs the trivariate breeding values for different traits. The corresponding correlation and regression coefficients are also presented in the sub-figures (for each trait). YW showed the lowest correlation coefficient (r = 0.957), the largest deviation of the intercept from 0 (a= 0.217), and the largest deviation of the regression coefficient (slope of the regression line) from 1 (b= 0.987). On the other hand, BW showed the least deviations. Deviating the regression coefficient from 1 indicates bias, considering the true assumption that BW phenotypes do not introduce bias to WW and YW evaluations. The bias for WW and YW in the bivariate analysis was minor and upward (b< 1), and it was due to natural/artificial preselection on BW.
Figure 2: Breeding values estimated via the univariate (BW) or the bivariate (WW and YW) versus those estimated via the trivariate (BW, WW, and YW) analysis
BW= birth weight, WW= weaning weight, YW= yearling weight.
BW had a higher expected rate of breeding value changes due to its higher heritability. However, BW breeding values were the least affected by the trivariate analysis (Figure 2). This is likely due to the lack of the preselection effect from WW and YW on BW. Though YW’s heritability was lower than WW’s heritability (Table 2), the rate of breeding value changes (i.e., correlation) was similar between the two traits. This is due to BW information directly and indirectly (via WW) influencing YW’s evaluation. In a similar study, Ramírez-Valverde et al(8) recommended a univariate model for BW, and a bivariate model for WW & YW, for the Angus breed. They also recommended bivariate models for BW & WW, and WW & YW, for the Tropicarne breed.
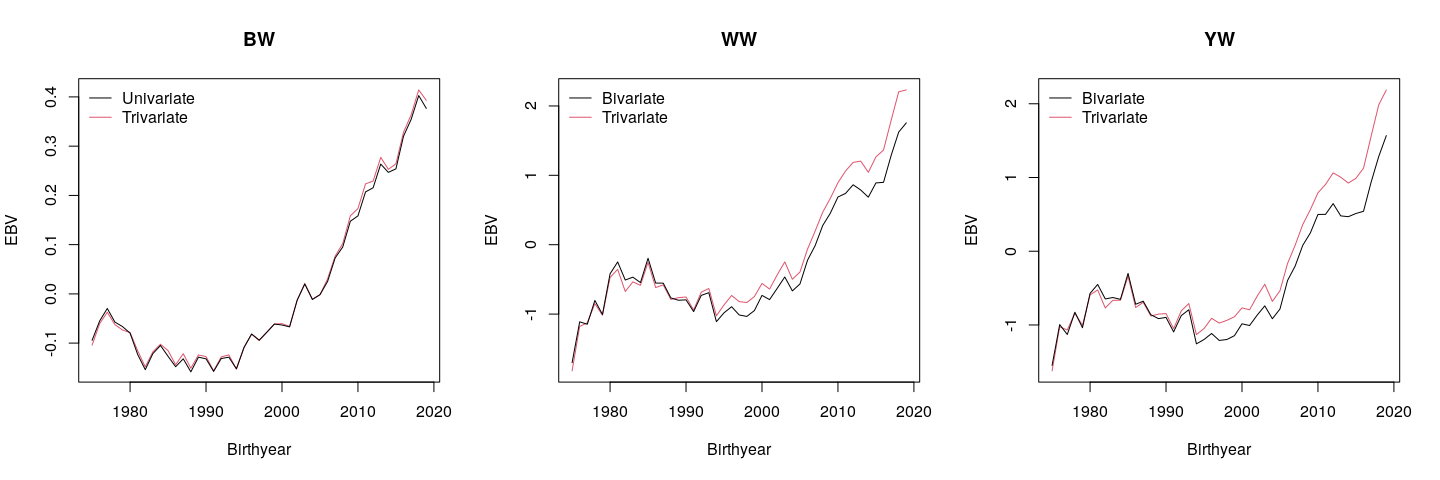
Genetic trends from 1975 to 2019 for different traits and analyses (univariate, bivariate, and trivariate) are shown in Figure 3. There were only 20 animals born in 2020. Therefore, 2020 was not considered when studying genetic trends. The rate of genetic gain was slow or negative in the 1980s and the 1990s for all the traits. Since the mid-1990s, genetic gain accelerated for all the traits. The univariate vs trivariate analysis did not affect the genetic trend of BW, which supports the other finding (b= 1.01 for BW, Figure 1) that the univariate BW evaluations are unbiased. On the other hand, the bivariate analysis showed bias in the genetic trends of WW and YW by underestimating young animals. Deviations between the breeding value averages were greater for animals born in recent years (Figure 3). This again showed the importance of BW data to avoid/reduce bias due to BW preselection for the evaluation of WW and YW.
Figure 3: Genetic trends estimated via the univariate (BW), bivariate (WW and YW), and trivariate (BW, WW, and YW) analyses
BW= birth weight, WW= weaning weight, YW= yearling weight.
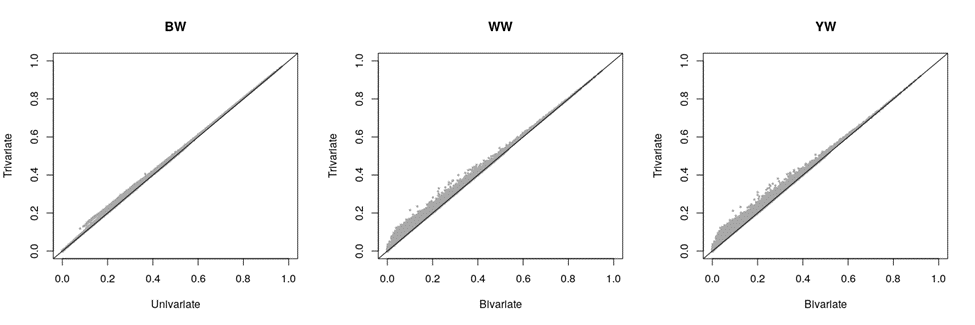
Figure 4 shows the accuracy gain from the univariate (BW) and the bivariate (WW and YW) model to the trivariate model. The average accuracy gain was 0.006, 0.010, and 0.011 for BW, WW, and YW, respectively. Possible reasons for BW’s low accuracy gain are: 1) There were only 766 animals with WW phenotype and without BW phenotype, of which 48 animals also had YW phenotype (Figure 1) 2) The heritabilities of WW and YW were lower than BW’s heritability (Table 2). The average BW accuracy gain for those 766 animals with WW and without BW phenotypes was 0.028. However, it should be mentioned that accuracy gain is not all about own phenotype but also about phenotype contribution from all the relatives (weighted by the relationship coefficient and the heritability). WW and YW gained more accuracy from the presence of BW in the trivariate analysis. This is likely due to 1) greater BW’s heritability and 2) many animals with BW phenotype and without WW and YW phenotypes (Figure 1; i.e., animals with little phenotype contribution for WW and YW receive phenotype contribution from the correlated trait BW). In fact, animals with low accuracy gained more accuracy from the trivariate analysis (Figure 4). Those animals had low phenotype contribution (most likely no own phenotype) in the univariate (BW) or the bivariate (WW and YW) analysis but gained phenotype contribution (via own performance and/or relatives) by the additional trait(s) in the trivariate analysis. For example, the average WW accuracy gain for the 13,483 animals with BW and without WW phenotypes was 0.037. Similarly, the average YW accuracy gain for the 13,474 animals with BW and without WW and YW phenotypes was 0.040. The average YW accuracy gain for the 718 animals with WW and without BW and YW phenotypes was 0.004, and for the 7,425 animals with BW and WW phenotypes and without YW phenotype was 0.015. Breeding values with low accuracy tend to regress toward the founders' solution, which is 0.
Figure 4: Breeding value accuracies estimated via the univariate (BW) or the bivariate (WW and YW) analysis versus those estimated via the trivariate (BW, WW, and YW) analysis
BW= birth weight, WW= weaning weight, YW= yearling weight.
The greater the heritability of the traits and the absolute genetic correlations among them, the greater the accuracy gain. Also, animals with missing phenotypes are expected to gain more accuracy from the correlated trait phenotypes. Tong(15) studied the relationships between heritability, genetic correlation (rg), and residual correlation (re) between traits in a multitrait animal model and found that: a) the greater the |rg – re|, the greater the accuracy gain, b) for |rg| < |re|, the trait with lower heritability gains more accuracy, and c) for |rg| > |re|, the trait with higher heritability gains more accuracy.
Conclusions and implications
For years, due to limited computational resources, genetic evaluations of growth traits (BW, WW, and YW) for the Mexican Braunvieh cattle were carried out in univariate models. Since 2016, WW and YW have been evaluated in a bivariate model. The most important reasons for multitrait evaluations are better use of available data and accuracy gain via correlations among the traits and removing/reducing bias caused by selection(11). The latter is more evident for traits measured and selected sequentially. The results showed unbiased univariate BW evaluations and sightly biased bivariate WW and YW evaluations caused by (non-random) selection on BW. Artificial selection on BW is presumably weak, and selection on other (correlated with BW) pre-weaning traits such as pre-weaning daily gain as well as natural selection on BW and those traits are involved. A multitrait model including all three traits is the solution to this problem, and we recommend its implementation to AMGSR. To tackle the increased computational cost by the trivariate model, it is proposed a data pruning strategy, reducing computational demands considerably. Pruned animals were then evaluated at a low computational cost using the solutions of animals in the analysis.
Literature cited: