https://doi.org/10.22319/rmcp.v15i2.6458
Article
Influence of the type of container and traditional methods on the long-term storage of honey produced by stingless Scaptotrigona mexicana: bioactive compounds and antioxidant properties
Naida Juárez-Trujillo a
Simón Carrouché b,c
María Remedios Mendoza-López d
Juan L. Monribot-Villanueva e
José A. Guerrero-Analco e
Maribel Jiménez-Fernández a*
a Universidad Veracruzana. Centro de Investigación y Desarrollo en Alimentos. Av. Dr. Luis Castelazo, s/n. 91000. Xalapa, Veracruz, México.
b Istom. Ecole-Supérieure D´agro-Développment International, Francia.
c Chasseurs De Saveurs S.L. de R.L. Company, Veracruz, México.
d Instituto de Química Aplicada, Universidad Veracruzana, Veracruz, México.
e Instituto de Ecología, A.C. Red de Estudios Moleculares Avanzados. Veracruz, México.
*Corresponding author: maribjimenez@uv.mx
Abstract:
Scaptotrigona mexicana honey is characterized by its nutritional and antioxidant properties, but it has a high moisture content that affects its stability during storage. The objective of this work was to evaluate the physicochemical and antioxidant properties by UV-Visible spectroscopy, profile of phenolic compounds by ultra-high performance liquid chromatography coupled to mass spectrometry and fatty acids and volatile compounds by gas chromatography coupled to mass spectrometry, minerals by microwave plasma atomic emission spectroscopy, from honey stored in different containers that, along with traditional methods, are commonly used to increase its stability. Most physicochemical and antioxidant properties were not significantly different from those of freshly harvested honey. The results suggest that the packaging with an exhaust check valve has a significant effect on the decrease in moisture content and water activity, but not on the physicochemical and antioxidant properties for at least 2 yr of storage. These results suggest that the type of container should be considered when storing honey as it significantly (P<0.05) affects its properties and quality.
Keywords: Antioxidant activity; Container; Honey; Scaptotrigona mexicana; Meliponine stingless bees.
Received. 08/05/2023
Accepted: 01/10/2024
Introduction
Stingless bee honey is highly demanded by consumers, due to its healing properties and quality(1). However, this type of honey is characterized by a higher moisture content, which increases the probability of its deterioration. In addition, it has been reported that excess water can be a negative quality attribute since it creates a high risk of inducing fermentation processes and consequently altering the organoleptic properties of honey(2). Various methodologies have been reported to maintain the nutritional and sensory properties of honey, increase its stability, and improve its handling and marketing conditions to obtain a safe product for the consumer(3), such as the use of dehydration in plastic trays using controlled-temperature ovens(4). However, exposure to high temperatures produces an increase in the content of hydroxymethylfurfural(5). It has been reported that heating to boiling temperature eliminates yeasts and reduces moisture content and that certain containers, such as unglazed clay pots, produce a reduction in moisture content of up to 20 %, increasing the shelf life of honey(6). However, clay containers have the disadvantage of being fragile, of low capacity and not functional for transport. In a traditional method used in the Totonacapan region, Veracruz, Mexico, beans are added to honey since, according to the inhabitants, these seeds absorb moisture from the honey, making it more stable. Another traditional technique is the use of vacuum packing to avoid the entry of air. Therefore, the objective of this research was to investigate the effect of storage in different plastic containers on the physicochemical properties, antioxidants, phenolic compounds and fatty acids profile, minerals and volatile compounds in honey during storage.
Material and methods
Chemicals
2,2´-Diphenyl-1-picrylhydrazyl (DPPH), Trolox (6-hydroxy- gallic acid, quercetin, Folin–Ciocalteu reagent and 2,4,6-Tris(2-pyridyl)-1,3,5-triazine (TPTZ) were purchased from Sigma (St. Louis, MO, USA).
Sample collection
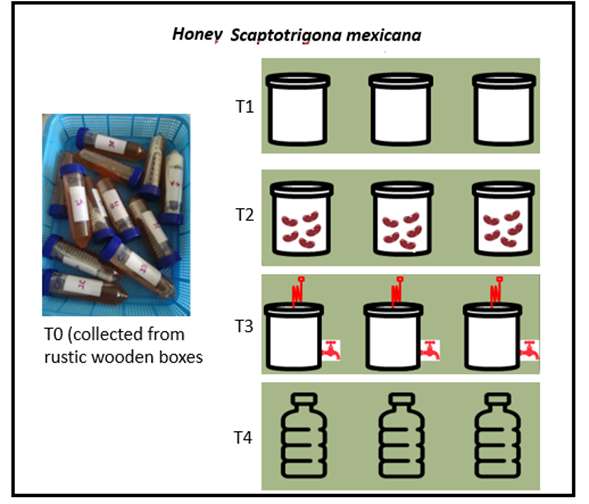
Twenty-four (24) liters of honey were provided by the company Chasseurs De Saveurs S.A. C.V. They were collected from the Zozocolco region, Veracruz, Mexico. Samples were collected from hives in rustic wooden boxes that meliponicultors keep in their homes. The extraction was carried out during the month of May 2018 using a 20 mL syringe. The 24-L batch of honey collected was divided into four batches (6 L per batch). The honey from each batch was divided into three 2-L containers (Figure 1). T0 (control) was immediately used for the analysis of the evaluated parameters and collected from rustic wooden boxes. Batches T1 to T4 were placed in plastic containers commonly used for the commercialization of honey. The description of the treatments is presented below: T1: honey stored in an opaque plastic tray (high density polyethylene), T2: honey stored in an opaque plastic tray added with five bean seeds, T3: honey stored in an opaque plastic tray with an exhaust check valve (ZAZOLYNE, China) used in the fermentation of wines, T4: honey stored in a transparent plastic container (polyethylene terephthalate, 1). The honey samples were placed in a room with a temperature of 25 ºC and were analyzed at the beginning and after 2 yr of storage. All the determinations were made by triplicate.
Figure 1: Packaging treatments for honey Scaptotrigona mexicana
T0= control; T1= honey stored in an opaque plastic tray; T2= honey stored in an opaque plastic tray added with five bean seeds; T3= honey stored in an opaque plastic tray with an exhaust check valve; T4= honey stored in a transparent plastic container.
Physicochemical properties
The moisture, electrical conductivity, pH, and titratable acidity of the honey samples were determined, using the appropriate analytical standard procedures(7). Electrical conductivity was determined using a conductivity meter (Mettler Toledo, ME 226 model, Pittsburgh, USA) and water activity was measured using a water activity meter (AquaLab, Model 4TE, Meter group, Inc, USA). The color was measured with a colorimeter (ColorFlex V1–72 SNHCX 1115, Hunter Lab, USA) using parameters CIE L*,a*, b* and total color change, browning index and Chroma were calculated.
Total phenolic compounds content, vitamin C and antioxidant activity
The content of total phenolic compounds and the antioxidant activity: DPPH (2,2-Diphenyl-1-picrylhydrazyl), FRAP (Ferric reducing ability of plasma) and ABTS (2,2'-azino-bis-(3-ethylbenzothiazoline-6-sulphonic acid) assays were determined using methanolic honey extract with a 1:100 dilution(8).
The total phenolic compounds were determined by the Folin-Ciocalteu method with some modifications(9). Thirty microliters of each sample and 30 μL of Folin-Ciocalteu were mixed and incubated for 2 min (40 °C). After 240 μL of Na2CO3 (5%) were added, they were incubated for 20 min (40 °C). After that time, the absorbance was read (λ= 765 nm). Vitamin C content was determined using a standard curve made with L-ascorbic acid (99% purity; Sigma Rec. 84272, St. Louis, Missouri, USA) at a concentration of 0–50 mg and the results were expressed as mg equivalents of ascorbic acid (AAE) per gram.
The percentage of inhibition of the DPPH radical was determined by mixing 30 µL of each sample with 270 µL of DPPH reagent, then incubated for 30 min, subsequently the absorbance was read (λ= 517 nm, Multiskan FC, model IVD, Finland). ABTS was determined, 30 μL of extract and 270 μL of ABTS reagent were mixed and then incubated for 30 min (25 °C). Then the absorbance (λ= 734 nm, Multiskan FC, model IVD, Finland) was measured. Finally, FRAP was determined, 30 μL of extract and 270 μL of FRAP reagent were mixed, then incubated for 30 min (37 °C) and absorbance was measured (λ= 593 nm, Multiskan FC, model IVD, Finland). For the two technics 0.1–1 mg/mL Trolox calibration curve was performed(9). The results are expressed in miligrams of Trolox equivalents per gram of dry weight of each sample.
UPLC-MS analysis
For the honey extracts, one gram of honey was weighed, 10 mL of methanol was added, and it was subjected to ultrasonication (Sonics Materials VCX 750 ultrasonic microprocessor, Connecticut, USA) for 10 min, this process was repeated until exhaustion. Subsequently, the solvent was evaporated to dryness in a rotary evaporator (Rotavapor R-100, Büchi, Flawil, Switzerland). Then, the honey extract (10 mg) was re-dissolved in 1.0 mL of MeOH with 0.1% of formic acid (Both MS grade, Sigma-Aldrich), filtered and placed in a 1.5 mL Ultra High-Performance Liquid Chromatography (UPLC) vial. The identification and quantitation of individual phenolic compounds was performed with an UPLC coupled to a triple quadrupole mass spectrometer (Agilent Technologies 1290-6460, Santa Clara, California, USA). Chromatographic conditions were: flow 0.3 mL/min, injection volume 2 µL, and column temperature 40 °C. The gradient started at 1% B, then changed to 50% B in 30 min, then 99 % B in 4 min followed by an isocratic step to 99 % B for 4 min. Subsequently, a gradient to 1% B in 1 min followed by an isocratic step for 5 min. The mass spectrometry conditions were electrospray ionization in positive and negative modes, temperature (T) of the gas 300 °C and T of the sheath gas 250 °C with flows of 5 and 11 L/min, respectively. The nebulizer pressure was 45 Psi and the capillary and nozzle voltages were 3,500 and 500 V, respectively. Forty-eight (48) compounds were searched: shikimic acid, gallic acid, L-phenylalanine, protocatechuic acid, 4-hydroxybenzoic acid, gentisic acid, 4-hydroxyphenylacetic acid, (-)-epigallocatechin, (+)-catechin, vanillic acid, scopoline, chlorogenic acid, caffeic acid, malvin, kuromanin, procyanidin B2, vanillin, keracyanin, (-)-epicatechin, 4-coumaric acid, mangiferin, umbelliferone, (-)-gallocatechin gallate, scopoletin, ferulic acid, quercetin 3,4-di-O-glucoside, 3-coumaric acid, salicylic acid, sinapic acid, epicatechin gallate, ellagic acid, myricitrin, pelargonidin, quercetin 3-D-galactoside, rutin, p-anisic acid, quercetin 3-glucoside, luteolin 7-O-glucoside, malvidin, 2,4-dimethoxy-6-methylbenzoic acid, penta-O-galloyl-B-D-glucose, kaempferol 3-O-glucoside, quercitrin, naringin, rosmarinic acid, trans-cinnamic acid, luteolin, and kaempferide. Each compound was identified using a dynamic multiple reaction monitoring method and quantified using calibration curves from 0.25 to 19 µM, with a coefficient of determination greater than 0.99(9).
GC-MS compounds
Volatile compounds (esters, aldehydes, ketones and terpenes that are characteristic of this type of sample) were determined in 3.0 g of honey stored. The honey was placed in a vial sealed with a PTFE / Teflon cap and heated to 100 °C, then the sample was injected using an Agilent Technologies Head-space model 7694E and a gas chromatograph (Agilent Technologies™, model 6890 N, Net Work GC system, Santa Clara, California, USA) equipped with a DB-5 capillary column (60 m × 0.25mm id × 0.25 µm film thickness) was used. The GC conditions were initial temperature: 45 °C for 5 min, heating ramp: 15 °C/min up to 280 °C, for 1 min. Helium at a flow of 1 mL/min, injector temperature of 250 °C. Identification of volatile compounds was performed by mass spectrometry using the Agilent Technologies™ Model 5975 inert XL mass spectrometer, mass spectra were obtained by electron impact ionization at 70 eV. For identification, the mass spectra obtained for each compound were compared with a database (HP Chemstation-NIST 05 Mass Spectral search program, version 2.0d).
Fatty acid profile
Oily material was extracted from honey using a Soxhlet extractor with hexane (60–80 °C) for 6 h. The oily extract was filtered and concentrated under vacuum (Büchi, Flawil, Switzerland) to get crude extracts. Methyl Esters of Fatty Acids (FAMEs) were obtained through an esterification process and analyzed by gas chromatography coupled to mass spectrometry (GC-MS)(10). A gas chromatograph (Agilent Technologies™, model 6890 N, Net Work GC system, Santa Clara, California, USA) equipped with a DB-5 column (5% methylpolysiloxane, cat-1225082, J&W Scientific, USA) was used. The GC conditions were: initial temperature: 150 °C for 5 min, heating ramp: 30 °C/min to a temperature of 210 °C, 1 °C/min to 213 °C for 40 min, finally 20 °C/min up to 280 °C for 40 min. Helium at a flow of 1 mL/min, injector temperature of 250 °C. Identification of fatty acids was performed by mass spectrometry using the Agilent Technologies™ Model 5975 XL Inert Mass Spectrometer. The identity of each fatty acid was assigned using an external standard (FAMEs mix, C8:C22, cat no. 18920-1AMP, Sigma-Aldrich) which contained: octanoic acid, decanoic acid, undecanoic acid, dodecanoic acid, tridecanoic acid, tetradecanoic acid, pentadecanoic acid, 9-hexadecenoic acid, hexadecanoic acid, cis-9,12, heptadecanoic acid, octadecadienoic acid, cis-9-octadecaenoic acid, heptadecanoic acid, eicosanoic acid, 11-eicosenoic acid.
Minerals analysis
For mineral extraction, honey (1 g) was digested in digester tubes with a nitric acid solution (5%) in a 1:10 (p:v) ratio. The tubes were placed in a Kjeldahl digester (Speed Digester K-439, Büchi, Flawil, Switzerland) and digested at 170 °C for 2 h until an almost clear solution was obtained. This solution was filtered and later transferred to a 50 mL volumetric flask and diluted with 5% HNO3 to finally be injected. The determination was performed with an Agilent MP 4100 MP-AES (Santa Clara, California, USA) consisting of a One Neb inert nebulizer, a double-pass glass cyclonic spray chamber, and a charge-coupled detector (CCD) of solid state. The plasma gas flow was 20 L/min and the makeup gas flow 1.5 L/min. A calibration curve was made from a mixture of 27 elements (Ag, Al, As, B, Ba, Be, Ca, Cd, Co, Cr, Cu, Fe, K, Mg, Mn, Mo, Na, Ni, Pb, Sb, Se, Si, Sr, Ti, Tl, V, Zn) with eight points (concentrations: 100, 75, 50, 25, 10, 7.5, 5.0 and 1 ppm). The coefficient of determination was greater than 0.98 for each element. The conditions of the equipment for the analysis were: capture time 13 sec, plasma stabilization time with sample aspiration 15 sec, reading time 3 sec (reading in triplicate) and washing time 20 sec.
Microbiological analysis
The count of total mesophilic aerobic bacteria and molds and yeasts was carried out by weighing 1 g of honey that was mixed with 9 mL of PBS buffer. Subsequently, serial dilutions were made until the 10-9 dilution was obtained. Finally, 1 mL of each dilution was seeded in Petri dishes and plate count agar (Difco™, BD Detroit US) and PDA agar (potato dextrose agar, BD™ Difco™ plate count agar) for aerobics were poured bacteria and molds and yeasts, respectively. Finally, they were incubated for 48 h and 5 d to 35 °C, and the colonies were counted.
Statistical analysis
Treatment and analysis were performed in triplicate, and the values were expressed as mean ± SD (standard deviation). All data were analyzed using one way of variance (ANOVA), followed by a Tukey’s test with a significance level of 5% (P<0.05) using Minitab 16 statistical software (Minitab Inc. State College, PA, USA)(6).
Results
Physicochemical property analysis
Table 1 shows the physicochemical properties of honey stored in different packages. The moisture content of the analyzed samples varied from 20.60 to 23.40 %, while the water activity varied from 0.663 to 0.675 after 2 yr of storage in the different treatments. Honey stored in a container with an anaerobic valve showed the greatest decrease in moisture content (20.60 %) and in water activity (0.667) compared to the control treatment, followed by honey stored in a transparent plastic container (moisture content: 22.80 %, aw= 0.675). High moisture content is related to the environment in which the flowers from which the bees collect nectar are found. In addition, it must be considered that honey obtained from stingless bees contains a greater amount of water, so the effect that the type of container and its permeability has a greater effect on its stability compared to commercial honey obtained from Apis mellifera(3,5).
The color parameters of the honey exhibited slight changes during storage; these changes were reflected in the chroma values and in the total color change. The sample stored in transparent containers (T4) exhibited a greater total color change (8.08).
The pH of the samples varied slightly from 3.23 to 3.66. The values of pH obtained in the samples were in the range reported for this type of honey(11). The total acidity of the samples stored in different containers (T1-T4) ranged from 85.66 to 87.33 meq/kg. The samples stored in the different types of containers (T2–T4) were not significantly different from each other but were different from the control sample (73.66 meq/kg). The acidity values for treatments T1–T4 were similar to those reported for stingless bee honey of 85 meq/100 g(12). The hydroxymethylfurfural (HMF) values of the samples stored in different containers (4.00–4.78 mg/kg) were not significantly different from those for the control treatment (4.09 mg/kg).
Antioxidant activity analysis
Table 2 shows that the content of total phenolic compounds, vitamin C and antioxidant compounds of honey stored in different containers were not significantly different (P>0.05) from that of the control treatment, except for vitamin C and DPPH radical inhibition. The content of total phenolic compounds varied from 12.55 to 14.31 mg GAE/100 g honey and that of vitamin C from 86.86 to 114.17 mg AA/g. Consistent with these values, the antioxidant activity determined by the DPPH radical scavenging activity presented high inhibition values (75.57–94.70 %). Similarly, the range of values determined by the FRAP (2.23-3.70 mg TE/g) and ABTS (0.61-1.13 mg TE/g) tests for the different types of containers show that honey contains compounds with a high capacity to reduce ferric ions and that they are stable during storage. These results are consistent with those reported for other types of honey(13) and the opposite to those reported for honey subjected to a temperature of 22–40 °C after 90 d of storage(14).
Table 2: Antioxidant properties of the honey recently harvested (T0-control), stored after two years in different containers (T1-T4)
The values are shown as the mean ± SD (n=3). AAE: Ascorbic acid equivalents. GAE: Gallic acid equivalents, TE: Trolox equivalents.
Different letters in each row indicate significant differences (P<0.05).
Phenolics identification and quantification by UPLC-MS
Table 3 shows the analysis of phenolic compounds present in freshly harvested honey and honey stored in different containers. A total of 17 phenolics plus two precursors (shikimic acid and L-phenylalanine) were identified in the honey stored in the different containers. Shikimic acid (35511–38504.90 µg/g dry extract), 4-hydroxybenzoic acid (2781.36–2996.87 µg/g dry extract), 4-hydroxyphenylacetic acid (1685.49–2294.62 µg/g dry extract) and L-phenylalanine (2917.68–3004.45 µg/g dry extract) were the major compounds in the samples. No significant differences (P>0.05) were found in most of the phenolics and precursors of the samples stored in the different containers after 2 yr of storage. The phenolics gentisic acid, 4-hydroxyphenylacetic acid, p-anisic acid and the precursor shikimic acid exhibited significant differences (P<0.05) in the samples stored in different containers, mainly in T4 (honey stored in a transparent plastic container). The profile of phenolic compounds found was similar to that reported for stingless honey by other authors(8), however, variations were found in relation to concentration, these differences in concentration have been attributed to floral and geographical variation and a collection time(8).
Volatile compounds
Table 4 shows that 18 volatile compounds were found in honey in the different treatments, ethyl acetate (20.20–30.24 %), cis-linalool oxide (30.05–34.73 %), trans-linalool oxide (12.97–15.75 %), and 1,5,7-octatrien-3-ol, 3,7-dimethyl (12.55-14.67 %) were the major compounds, representing approximately 50 % of the volatile compounds present in the samples. Alcohol derivatives were the predominant ones found in honey during storage.
Table 4: Volatile compounds (%) determined in the honey recently harvested (T0-control), stored after two years in different containers (T1-T4)
Results are expressed as the mean ± SD (n=3).
RT= retention time.
ab Different letters in the same row are significantly different (P<0.05). --Not present.
Fatty acids present in the honey
Analysis of the hexane extract of the honey samples revealed the presence of eight fatty acids (Table 5). Hexadecanoic acid (31.12–49.65 %), octadecanoic acid (21.48–26.86 %) and cis-9-octadecadienoic acid (14.31–40.04 %) were the major compounds found in the different stored samples.
Table 5: Relative area (%) of fatty acids in the hexane extract in the honey recently harvested (T0-control) and stored after two years in different containers (T1-T4)
Results are expressed as the mean ± SD (n=3).
RT= retention time.
abcd Different letters in the same row are significantly different (P<0.05). -Not present.
Mineral content analysis
The mineral content remained constant during storage, and it descended in the following order: K > Mg > Ca > Na > Si, for honey stored in the different containers (Table 6). The concentration of As, Be, Cd, Mo, Ni, Pb, Sb, Ti, Tl and V was similar to that reported by Villacrés-Granda et al(2). K (109.36–125.68 mg/100 g DW) and Mg (31.60–100.49 mg/100 g DW) were found in higher concentrations compared to the other minerals present. Potassium was the majority mineral, representing a third of the total content and exceeding that of other minerals by approximately 10 times. No statistically significant differences were found for the minerals investigated in most samples evaluated during storage.
Table 6: Mineral and trace elements (mg / 100 g DW) in the honey recently harvested (T0-control) and stored after two years in different containers (T1-T4)
These values are the average of three determinations.
ab Different letters in the same row are significantly different (P<0.05). -: no detectable.
Microbiological analysis
The results showed a higher number of microorganisms in the initial samples for total aerobic mesophilic bacteria (1.50 x 10² CFU/g) and molds, and yeast (2.30 x 10² CFU/g), compared to the samples in different containers stored for two years (Table 7). The results obtained for the analysis of microorganisms for the samples at the beginning of storage ranged from 0.78 x 10² - 0.98 x 10² CFU/g of sample for aerobic mesophiles and 0.03 x 10²- 0.32 x 10² CFU/g of sample for molds, and yeasts.
Table 7: Total aerobic mesophilic bacteria, and molds, and yeast present in samples at the beginning and after two years of storage in different containers
These values are the average of five determinations (n=5).
ab Different letters in the same column are significantly different (P<0.05).
Discussion
Determination of the physicochemical properties, such as moisture, pH, acidity, and Brix degrees allow the evaluation of honey quality. The moisture of honey favors the growth of bacteria and fungi present in honey. The range of moisture values obtained for the different treatments was consistent with those reported for the honey from Ecuadorian stingless bees(2). It was found that the sample stored in the container with an escape check valve showed a significant reduction in moisture content compared to the initial treatment, which it is possibly due to the gases produced by fermentation dragging the moisture present into the headspace of the container, preventing the moisture from returning. At the same time, color changes in honey are related to its botanical origin, mineral content, the content of phenolic compounds, antioxidant properties, room temperature, and storage time. The change in honey stored in the transparent container is possibly because light could affect the components of the honey such as carotenoids and flavonoids(15)..
The values of pH and the total acidity, play an important role in the quality of the honey(11). The acidity values show that this honey stored for 2 yr has a higher acidity. The increase in acidity value during storage may be related to the fermentation of honey and to its antimicrobial properties, but it may also result in an undesirable vinegar taste because of acetic acid production. The acidity of honey is related to the glucose content. Glucose is converted by the action of the enzyme D-glucose oxidase into gluconic acid. This process produces hydrogen peroxide which is a component of the antimicrobial action of honey(16). The production of acids occurs not only by enzymatic action but also by fermentation of the microorganisms present in the matrix. Increased acidity may also be associated with the transformation of sugars from honey into alcohols and then into organic acids by osmophilic yeasts. It is also necessary to consider that when the moisture content is high, the bacteria grow and ferment the sugars, producing compounds such as acetic acid that can affect the taste of honey(17).
A very important quality factor in honey is the HMF concentration, since it is an indicator of the quality, freshness, and aging of honey. Under conditions such as processing or aging, mainly influenced by temperature fluctuation, pH, storage conditions, and floral origin, may help bring about its presence(18).
The antioxidant activity of honey depends on its floral origin and the processing conditions and is closely related to the chemical compounds it possesses. The components of honey – phenolic compounds, flavonoids, and phenolic acids, as well as chlorophyll, carotenoids, and vitamin C – contribute to its antioxidant activity(15), coupled with the fact that the antioxidant properties are related to its color and the moisture content.
The antioxidant activity of honey is due, among other factors, to the presence of phenolic compounds, which are produced in plants as a protection system and are entrained in the nectar extracted by bees. UPLC analysis revealed the presence of shikimic acid, 4-hydroxybenzoic acid, 4-hydroxyphenylacetic acid and L-phenylalanine, among others. These compounds confer antioxidant activity to honey since they possess delocalized electrons, which cause free radical scavenging activity(19). The radical scavenging activity of phenolics mainly depends on the number and position of hydroxyl groups in the molecules. The presence of these compounds is explained by the fact that shikimic acid is a precursor of aromatic metabolic intermediates, within which are flavonoids such as luteolin(20). The presence of these phenolic compounds may suggest possible anti-inflammatory and antimicrobial activity, among other properties. Consistent with the analysis of total phenolic compounds, the concentration of most of the quantified phenolic compounds decreased in the sample subjected to heat treatment, compared to the control. This helps to explain the decrease in antioxidant activity.
Identifying volatile compounds plays a crucial role in assessing the quality of honey. These compounds, linked to flower nectar, geographical origin, and overall stability, offer insights into the honey's unique characteristics(21). When honey is stored in various containers, there is an increase in volatile compounds over the initial storage day. Notably, esters, aldehydes, ketones, and alcohols become predominant after 2 yr, contributing significantly to the honey's odor and flavor. The appearance and rise of specific volatile compounds may be linked to the fermentation process, with packaging type influencing oxygen availability and anaerobic respiration enhancement. Moisture content further affects fermentation, favoring the production of alcohol, carbon dioxide, and acetic acid, all influencing the concentration of volatile compounds in honey(17).
Free fatty acids, akin to volatile compounds, serve as lipid markers reflecting the floral origin of honey and can be crucial authenticity indicators(22). Changes in the concentration of certain volatile compounds in honey stored in containers are likely due to the container material's permeability. Plastics, in particular, may retain some volatile compounds, facilitating their transfer between honey and the container material. This involves the adsorption or retention of volatile compounds in honey, causing shifts in their concentration. Additionally, some volatile compounds might be lost or absorbed, affecting the honey's aromatic profile and consequently altering its taste and aroma. Fatty acids such as hexadecanoic acid increased in proportion, while the proportion of dodecanoic acid decreased, and others like decanoic acid and 9-hexadecenoic acid emerged during storage. These changes may be related to variations in water activity and the permeability of different containers used for storage. Another factor is that honey crystallization can impact the mobility and availability of fatty acids, influencing their proportion.
Mineral content is another quality factor for honey. The analysis shows that the type of minerals and their concentration does not vary during storage in the evaluated containers, and it was similar to those reported by other authors regarding other types of honey; Consistent with other reports, potassium was the most abundant mineral, this is considered the most quantitatively important mineral in the honey, accounting for around 50 % of the total mineral content. The presence of Al, Ba, Si, and Co is mainly since these minerals are naturally present in the environment, demonstrated that the honey is a very good environmental indicator so reflects the content of toxic elements in the surrounding water, soil, and air(23). Honey can contribute to the diet with elements such as Mg, Ca, and K. Mg and K are important micronutrients for the human body since they are involved in many physiological processes and are essential for the maintenance of the normal function of cells and organs, by which they make an important contribution to health(24). These results are also consistent with those reported in a study on honey from stingless bees from Brazil, where it was found that these minerals are the most important quantitatively(8).
Honey can contain microorganisms from different resources, such as pollen digestive tracts dust, air soil, and nectar, or due to handling and processing. The presence of these microorganisms can affect the quality of honey during storage, so an analysis of the total count of aerobic microorganisms and molds, and yeasts were performed at the beginning and end of storage in different containers. These values were below the limit reported by other authors and that established for Apis mellifera honey, which may be due to proper handling in harvesting and the presence of phenolic compounds, organic acids, and other bioactive compounds present in the honey that has an inhibitory effect on this type of microorganism. The concentration of total aerobic microorganisms and molds and yeasts decreased in honey during storage, which is consistent with the reduction in water activity and moisture. This could be attributed to various factors such as sugar crystallization or water evaporation due to plastic permeability. The decrease in microorganism concentration is a positive factor that ensures the quality of honey during its storage.
Conclusions and implications
In this study, a comparison was made between plastic containers used commercially, since the use of other types of containers, such as glass or metal, are more expensive for the producer. The study demonstrated that storing honey in traditional plastic containers (high-density polyethylene and polyethylene terephthalate) and using certain traditional methodologies provide significant differences in the moisture content of honey during storage, with the moisture content being minor in honey stored in the container with an escape check valve (T3). It was also found that, in general, storage for 2 yr does not produce major changes in the physicochemical properties and in the content of phenolic compounds, which are associated with a decrease in antioxidant properties and volatile compounds that together can affect the honey quality. Furthermore, storage had a positive effect on the microbiological analysis of the honey. Finally, the evaluation of these parameters suggests that treatment T3 would be the most suitable for storing honey since it presented a total color change of less than 3, an important quality parameter for consumers.
Acknowledgments
The Authors would like to thank Company Chasseurs De Saveurs S.A. C.V. from Coatepec Veracruz for providing the honey. Also, we are grateful to the Mexican Association of Edible Forests.
Disclosure statement
No potential conflict of interest was reported by the authors.
Literature cited:
Table 1: Physicochemical properties of the honey recently harvested (T0-control), stored after two years in different containers (T1-T4)
Data represent the average of three replicates or measurements ± standard deviation.
abcd Different letters in the same row indicate significant differences (P<0.05).
-- Not present.
Table 3: Phenolic compounds (µg/g dry extract) of the honey recently harvested (T0-control), stored after two years in different containers (T1-T4)
Results are expressed as the mean ± SD (n=3).
ab Different letters in the same row are significantly different (P<0.05).