https://doi.org/10.22319/rmcp.v15i2.6366
Article
Study of the Genetic Structure and Diversity of Holstein cattle in the small holder system in Mexico
Felipe de Jesús Ruiz-López a
José G. Cortés-Hernández b
José Luis Romano-Muñoz a
Fernando Villaseñor-González c
Adriana García-Ruiz a*
a Instituto Nacional de Investigaciones Forestales, Agrícolas y Pecuarias (INIFAP). Centro Nacional de Investigación Disciplinaria en Fisiología y Mejoramiento Animal. Ajuchitlán Colón, 76280 Querétaro, México.
b Universidad Nacional Autónoma de México. Facultad de Medicina Veterinaria y Zootecnia. Ciudad Universitaria, Ciudad de México. México.
c INIFAP. Campo Experimental Centro-Altos de Jalisco. México.
*Corresponding author: garcia.adriana@inifap.gob.mx
Abstract:
The objective was to know the population structure of Holstein animals in the family dairy system, to identify possible origins of the genetic material, to know the degree of inbreeding and to identify possible traces of selection in the genome, which allow glimpses of the traits that have been improved over the years. The study included 270 animals genotyped with the GGP-50K® chip. After genotype quality control, 43,548 autosomal SNPs were included. To know the population structure, analyses of mixtures and principal components (PCs) were performed. To know genomic inbreeding and detect traces of selection, information on runs of homozygosity (ROH) was used. Mixture analysis was performed with the Admixture software, and PC, ROH and inbreeding analyses were performed with SVS-v7.6.8. Mixture analysis showed evidence of six components, all linked to Holstein bulls families with different country of origin. The PCs did not show stratification of the population by herd. The mean inbreeding coefficient was 0.59 ± 0.53 %. In the regions of the genome with ROHs most frequent in the population (≥20 animals), numerous associations, QTLs and genes related to milk production and composition, fertility parameters, susceptibility to diseases, body conformation, feed efficiency and some characteristics of carcass composition have been reported. The results reflect the existence of a wide genetic diversity in this population and the possibility of carrying out genetic improvement work through selection without affecting inbreeding levels.
Keywords: Genetic diversity, Traces of selection, Inbreeding, Family dairy system.
Received: 17/12/2022
Accepted: 09/05/2023
Introduction
The cattle dairy industry in Mexico produced around 11.489 billion liters of milk nationwide in 2020 (SIAP, 2020)(1), of which more than 30 % of the volume was produced in the family dairy system (FDS), which includes approximately 78 % of the farms(2). In the FDS farms, Holstein animals predominate, although Brown Swiss animals and their crosses can be found(3). Currently, in this system there is little information on production records by animal and on rare occasions genealogical information can be collected, which makes it unfeasible to carry out genetic evaluations of the animals in this system. The genetic improvement of these animals has been carried out by the selection performed by the cattle farmer within their herd, or by the introduction of genetic material, but there is no evidence of directed mating for a specific genetic purpose.
The use of genomic information has made it possible to describe the structure of populations that do not have genealogical information or records. The study of these populations or animals has been carried out from the study of single nucleotide polymorphism (SNP) markers or their clustering pattern, such as for example, runs of homozygosity (ROHs), which are homozygous segments in the genome, identical by descent, which can be used to study population structure, demographic history and to decipher the genetic structure of complex diseases(4). ROHs are the result of crossbreeding between related individuals(5) from populations with a high level of selection intensity, influenced by the availability of replacements and the adoption of technological and reproductive tools(6), or low rates of recombination(7). Their distribution and length depend on the intensity of selection, being more frequent and more extensive when it is higher(8), when mating between close relatives is frequent or when the size of populations is small(4).
The potential of ROHs to help the genetic improvement of production animals is big due to the fact that they contain a large number of genes that encode traits of interest(9). In addition, the identification of ROHs can help to visualize and recognize haplotype patterns characteristic of breeds or species(7), allowing the identification of genomic regions with possible traces of selection for the breed(10) and the calculation of individual inbreeding levels. The latter is done by evaluating the portion of the genome covered by ROH segments, especially since there is a high probability of detecting genomic information from ancient relationships(11). This is a useful tool for populations that do not have genealogical information(12).
Traces of selection are regions of the genome that have been conserved for generations in populations due to natural or artificial selection. These sequences of genetic material are related to functionally important traits(13) and their detection helps to identify candidate genes that have been favored in the selection processes to which populations have been exposed, and to identify beneficial mutations. In addition, they help to understand the molecular pathways related to phenotypic traits(14,15).
With SNP marker analyses, it is also possible to know the population structure through mixture analysis and to know the most influential origins in a population. In addition, through information-reductive methods, such as principal component analyses, it is possible to determine patterns of population structure, important information for establishing the basis for a genetic improvement program.
The objective of this study was to know the population structure, identify possible origins of the genetic material, know the degree of inbreeding, and identify possible traces of selection in the genome that allow us to glimpse the characteristics that have been improved over the years by the decisions of cattle farmers in family production systems in Mexico.
Material and methods
A total of 270 Holstein cow genotypes were used, randomly chosen from the population present in three FDS herds located in the region of Tepatitlán, Jalisco, Mexico. The animals were genotyped with the GeneSeek Genomic Profiler Bovine GGP 50K® chip. Quality control of genomic information consisted of excluding animals with a call rate <0.90, excluding SNPs with minor allele frequency (MAF) < 0.02, or with a call rate < 0.95, or with a Hardy Weinberg P-value < 0.0001(16,17). After quality control, 43,548 autosomal SNPs were included.
In order to know the structure and main population origins, a mixture analysis was carried out through estimation based on likelihood models that define the structure of ancestry in unrelated individuals, a methodology implemented in the Admixture V 1.3.0(18) software. On the other hand, Principal Component (PC) analyses were performed to identify possible population groupings by herd. To estimate inbreeding with genomic information and traces of selection in the population, ROHs were searched in the genome. To define ROHs, runs with a minimum length of 500 kb and a minimum number of 25 SNPs, with a minimum density of 1 marker every 50 kb and a maximum gap between contiguous homozygous markers of 500 Kb were included. With the aforementioned parameters, the risk of including very short ROHs was avoided, a common case due to linkage disequilibrium (LD)(17). LD is associated with the presence of linked genes, so when they are inherited from parents to children, they do so jointly, affecting the frequency of recombination (less than 50 %) and the presence of ROHs in the genome(19). In addition, 1 heterozygous SNP and 5 genotypes lost per run were allowed(20,21).
ROH analysis was performed using the bioinformatics platform called SNP & Variation Suite v7.6.8 Win64 (Golden Helix, Bozeman, MT, USA)(22), while the analyses of the data obtained were carried out with SAS Institute 9.3.(23). To analyze the distribution of LROH, six classes were defined according to their length, which were 0.5 to 4, >4 to 8, >8 to 12, >12 to 16, >16 to 20, and >20 Mb(24).
Traces of selection were detected through the loss of genetic variation, using the ROHs identified in the genome, using the most frequent in the population (in at least 10 % of the animals). According to their physical position in the genome, annotations, or regions previously related to genes, QTLs or traits that have been made in other populations and that are reported in the Animal QTLdb Release 43 database(25) were identified. In addition, traces of selection previously reported in the Bovine Genome Variation database (BGVD) were searched in order to find genomic information that helps to know possible characteristics that have been selected in the population of the Family Dairy System (FDS) in Mexico.
For the calculation of the coefficient of inbreeding by runs (FROH), the methodology proposed by Mcquillan et al(27) was used, who defined it as FROHi=ΣLROHi/ Lauto, where FROHi is the endogamy coefficient of individual i calculated by ROH, ΣLROHi is the total sum of the ROH segments of an individual i above a specified minimum length, in this case > 500 kb, and Lauto is the length of the autosomal genome covered by SNPs including centromeres. As the year of birth of the animals is unknown, the inbreeding trend by lactation number of the animals at the time of sampling was calculated.
Additionally, the calculation of the inbreeding coefficient was carried out through observed and expected homozygous markers (FHOE) for all animals, which has been reported to have a correlation of 0.96 ± 0.001 with the genomic relationship matrix in Holstein cattle(28), the values of FHOE can range from −1 to +1. The negative numbers refer to the exogamy present in mating between individuals from different populations and the positive values indicate the level of endogamy of individuals from the same population; the calculation was performed through the method referenced by Ferenčaković et al(11) with the program called SNP & Variation Suite v7.6.8 Win64 (Golden Helix, Bozeman, MT, USA)(22).
Results and discussion
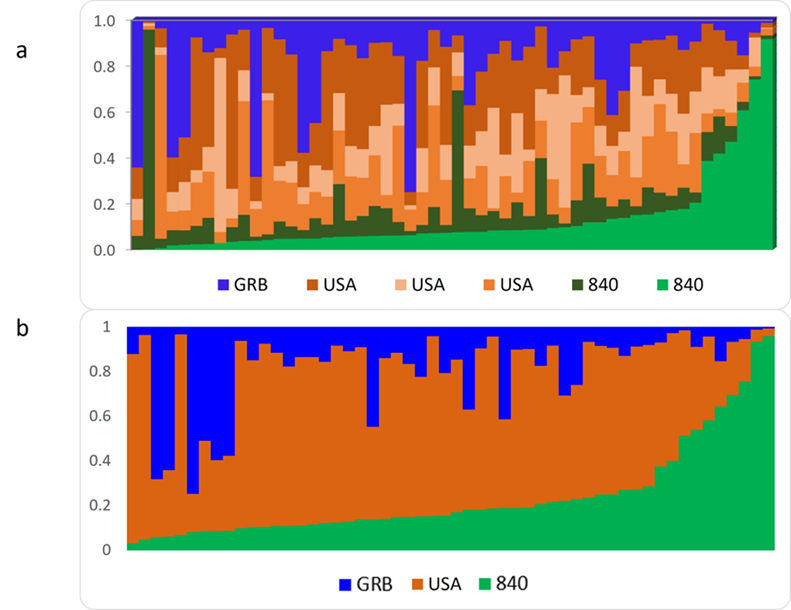
In the analysis of mixtures, the value that best defined the number of ancestral populations (K) was six and according to the information collected from some cow parents, six large families were identified, defined mainly by the country of origin of the bulls. Figure 1-a shows the population structure linked to the six main groups by country of origin of the bulls, although some of these families share the same country of origin. Therefore, the groups that shared the same origin were combined, leaving only three large groups represented, two representing the United States of America and one representing the United Kingdom (USA, 840 and GBR, respectively) (Figure 1-b). The origins USA and 840 correspond to the United States of America, only that the 840 is assigned to animals that use radio frequency identifications (RFID), devices issued by the International Committee for Animal Recording (ICAR), while animals registered with the USA country of origin do not carry an RFID and the use of genetic material is locally or more limited than those of the 840(29). The results of this study show the genetic dependence of the family system in Mexico on foreign material, mainly from the United States, since more than 80 % of the origins were linked to families with origins from this country, either from local trade or from those registered internationally.
Figure 1: Population structure of Holstein cattle in the family system a) including the six origins attributed to bull families and b) grouped by country of origin
Although another study(29) had reported the influence of other breeds of dairy cattle on the family system, the present study found no evidence of the use or crossbreeding with other breeds. These results could suggest that cattle farmers have followed a more directed mating system, and that they limit themselves to using animals of the same breed in services.
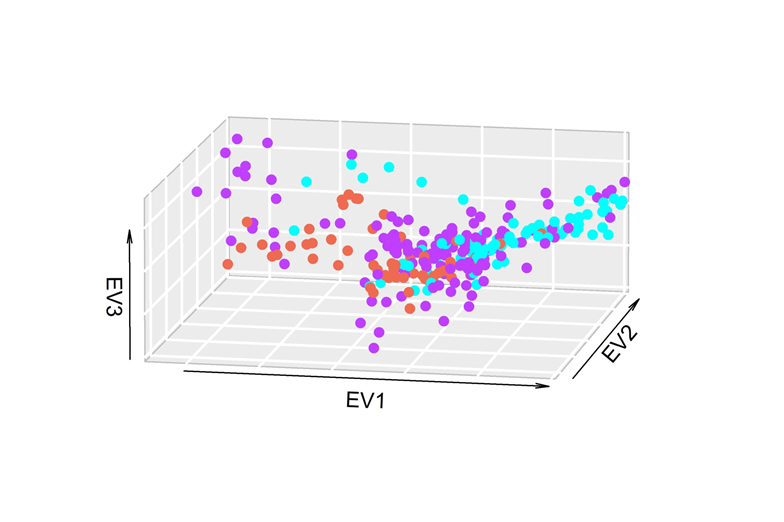
In the PC analyses (Figure 2), no stratification was found by country of origin of the bull, and when the herd of origin was evaluated, a homogeneous herd (purple) was observed in the population, and a difference was observed between the animals of the other herds (red and blue). The percentage of variability associated with each component was 2.9, 2.0, and 1.8 for components or eigenvalues (EV) 1, 2, and 3, respectively.
Figure 2: Principal component analysis of the family system population with Holstein phenotype, defined by herd of origin
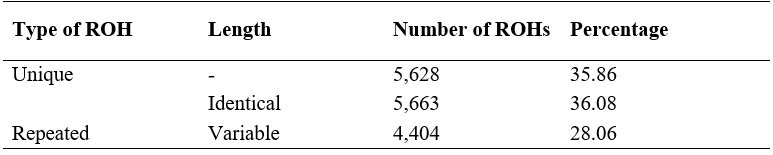
The total number of ROHs (NROH) found in the studied population was 15,695, with an average length (LROH) of 4.79 Mb, a minimum and maximum length of 0.5 and 91.49 Mb, respectively. The average length of the genome covered by ROH was 278.76 Mb, with a minimum and maximum of 13.28 and 535.83 Mb, respectively. According to the frequency of ROHs in the population, they were identified as unique (in a single animal) or repeated, the latter with the same length (identical) or of variable length. Thirty-five point eight six (35.86) percent of the ROHs were unique (Table 1), while 64.14 % (10,067) were repeated.
Table 1: Number and percentage of unique runs of homozygosity (ROHs) and repeated ROHs with the same start and end position, as well as variable positions
The NROH was lower compared to that reported in animals that come from specialized production systems, which could be attributed to a lower intensity of selection since the loss of genetic variation or the formation of ROHs in the genome is influenced, among other factors, by the level of intensity of selection in the populations, which in turn is determined by the availability of replacements and adoption of technological and reproductive tools, such as artificial insemination (AI) and embryo transfer (ET). In dairy cattle, the intensity of selection is very high and the selection of genetic material is influenced by a limited number of parent families, so the mating of related individuals may be common(30). In Holstein cattle from the specialized production system in Mexico, the NROH was 88,529, with a larger population size (~4,500 animals) and LROH was greater than 8.95 Mb(24). In other studies in Holstein cattle from the specialized system, the LROH reported are even higher; for example, in the US it is 299.6 Mb(31) and in Italy it is 297 Mb(32).
The average number of ROHs per animal was 58.13 ± 11.89, with a maximum and minimum of 92 and 10, which is a high value compared to the results of Holstein cattle from the specialized system in Mexico(24), reported on average at 20.07 ROHs per animal, with a maximum of 283 and a minimum of 1. Studies in other Holstein populations of intensive production have reported around 82.3 ± 9.83 ROHs per animal in Holstein cattle from the US(31) and 81.7 ± 9.7 runs per animal in Holstein cattle from Italy(32). These differences may be due to the high degree of selection in the populations of specialized production systems in both the US and Italy, as well as the availability of genetic material from highly selected bulls compared to the FDS that was analyzed, where the selection objectives are not so defined.
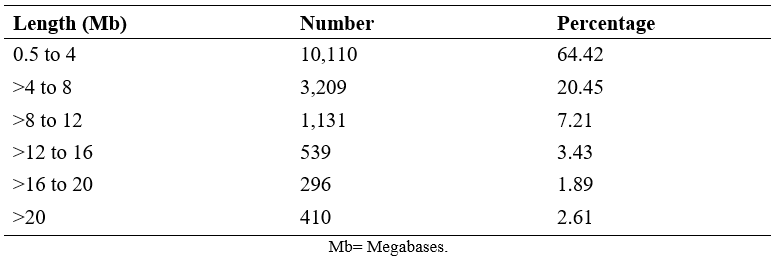
According to the classification of LROH, the most frequent runs were the shortest (0.5 to 4 Mb) with 64.42 %, followed by those from 4 to 8 Mb with 20.45 %, and the least frequent were the longest runs (>16 to 20 and >20; Table 2). The lengths of the ROHs provide information on the number of generations in which the common ancestor is shared, with the longest being those formed in recent generations(21), so the length of the ROHs found in this population reflects recent and low inbreeding.
Table 2: Frequency of runs of homozygosity (ROH) at different lengths
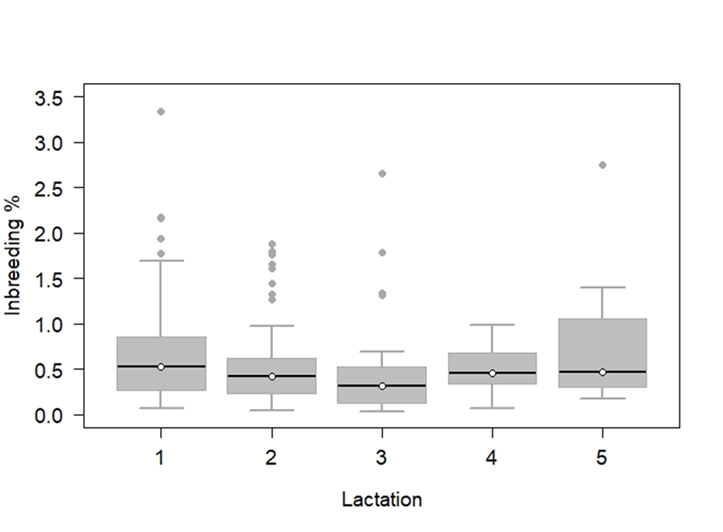
The average inbreeding coefficient (FROH) in the population was 0.59 ± 0.53 %, with a maximum of 3.35 % and a minimum of 0.034 %. The results are consistent with the small number of ROHs found and the short average length. These values were well below what was reported in other highly selected Holstein cattle populations; for example, 4.2 % in the US(33). Although the inbreeding found in this population was insignificant, a value that is confirmed by the values calculated for FHOE, which were -0.02 ± 0.08, when reviewing the averages by number of births, a slight increase in FROH was found in recent generations, which could indicate the beginning of an unfavorable trend for the group studied (Figure 3).
Figure 3: Genomic inbreeding (FROH) percentages by lactation number at the time of sampling
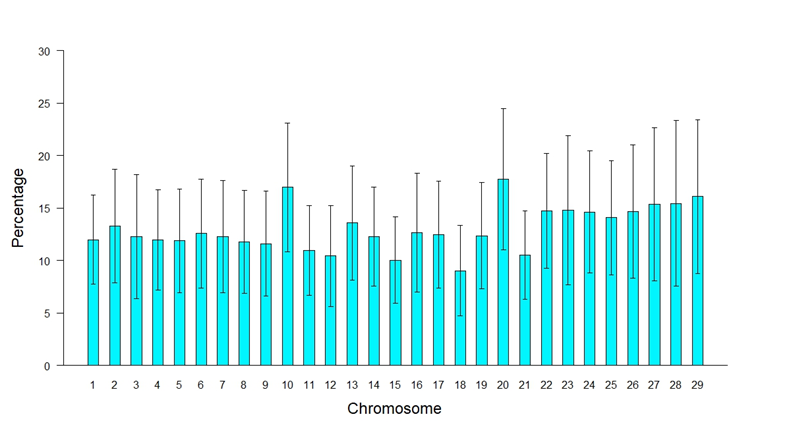
To identify traces of selection throughout the genome, it was searched for specific chromosomes and regions in the location and distribution of ROHs. The presence of ROHs occurred to a greater extent in the long chromosomes than in the short ones, although the latter presented a higher proportion of the genome covered by homozygous regions, as was the case of chromosomes 10 and 20, which presented 10 and 20 with 16.98 % and 17.76 % (Figure 4), behavior similar to what was reported by Szmatola et al(34) in Holstein cows from Poland, suggesting that these regions have been subject to greater selection, due to association with traits of economic interest. The percentages of homozygosity per chromosome are higher than the average FROH value because the length of the chromosome is taken as one hundred percent and not the total length of the genome covered by the SNPs; this gives a better perception of the length of the chromosome covered by ROHs.
Figure 4: Percentage of chromosome covered by runs of homozygosity (ROH)
Throughout the genome, a positive relationship was observed between chromosome size and the number of ROHs detected on that chromosome, but this was not the case for the percentage of chromosome length covered by ROHs since short chromosomes showed a higher proportion covered by ROHs (Figure 5), this is because the average length of ROHs was greater in short chromosomes than in long chromosomes, because long chromosomes have more recombination than short chromosomes(8). Of the total ROHs determined in the population, chromosomes 1 and 6 were the ones with the highest number of ROHs (5.98 and 5.39 %) and the chromosomes with the lowest number were chromosomes 28 and 27 (1.31 and 1.50 %), results that are similar to those of Purfield et al(17), who also reported a higher number of ROHs on the long chromosomes than on the short ones.
Figure 5: Percentage of runs of homozygosity (ROH) on each chromosome
According to the frequency of repeated ROHs in the population, only 35 were found in 10 or more animals and were distributed on chromosomes 2, 3, 4, 5, 6, 8, 9, 10, 11, 12, 13, 14, 15, 17, 19, 21, 22, 23, 26, and 29. The most frequent ROHs were found on chromosomes 2 and 22, in 27 and 23 animals, respectively, with the length in these runs being 1.82 Mb and 1.61 Mb. In the same position as the runs found on chromosome 2 (83.84-85.66 Mb), Cole et al(35) reported QTL (Quantitative Trait Loci) related to hip width and height in Holstein cattle from the US; Cai et al(36) reported QTLs associated with milk fat production in Holstein cattle from Nordic countries, which may indicate traces of selection on these chromosomes(37).
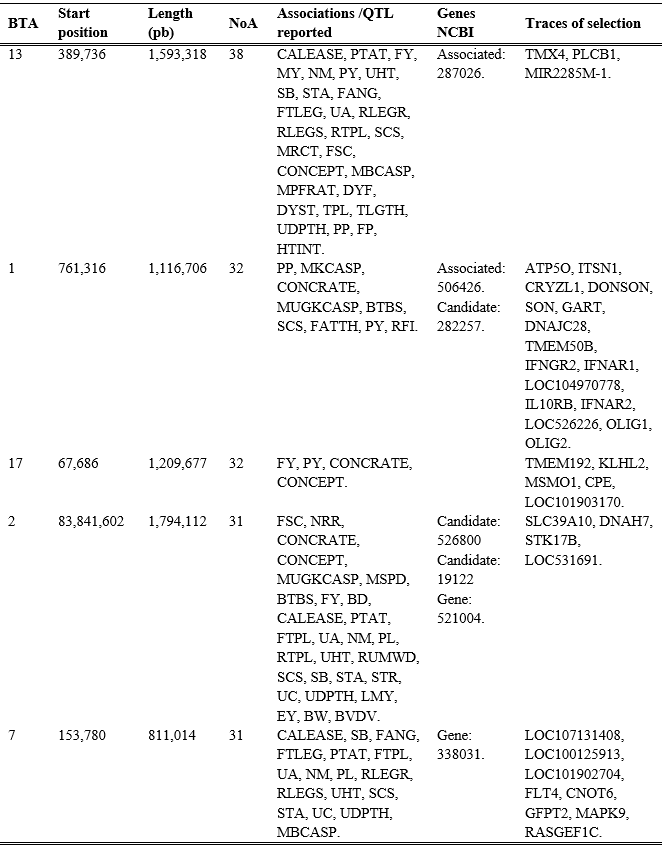
Of the total ROHs of variable length, only 37 were found in 10 or more animals, distributed throughout the genome, except on chromosome 8. In the region where the most frequent ROHs in the population were found (≥20 animals), numerous associations, QTLs and genes related to milk production and composition, fertility parameters, susceptibility to diseases, body conformation, feed efficiency and some characteristics of carcass composition (Table 3) have been reported. The results show that, although the ROH lengths in this population (~4.79 Mb) suggest crossbreeding of animals related approximately 16 generations ago(11), the conserved regions could indicate that selection in this population is aimed at improving milk production, composition, fertility, and health, as could be expected in milk production systems. On chromosomes 1 and 2, in addition to associations with characteristics of interest in dairy cattle, associations with carcass characteristics are observed, findings that could suggest possible crosses with other breeds.
To search for ROH annotations with variable length, the shortest ROH with respect to the final position was used as a reference (Table 3), to avoid providing information outside the region common to all animals with a specific ROH.
Table 3: Genome annotations found in regions where the most frequent runs of homozygosity (ROH) in the family dairy population were detected
BTA= chromosome, NoA= number of animals.
Associations /QTLs reported. CALEASE= calving ease, PTAT= conformation final score, FY= milk fat yield, MY= milk yield, NM= net merit, PY= milk protein yield, UHT=udder attachment height, SB=stillbirths, STA= stature, FANG= foot angle, FTLEG= foot and leg conformation, UA=udder attachment, RLEGR= rear leg placement - rear view, RLEGS= rear legs- side view, RTPL= rear teat placement, SCS= somatic cell score, MRCT= milk rennet coagulation time, FSC= first service conception, CONCEPT= number of inseminations per conception, MBCASP= milk B-casein percentage, MPFRAT= milk protein-to-fat ratio, DYF= dairy character, DYST= dystocia, TPL= teat placement, TLGTH= teat length, UDPTH=udder depth, PP= milk protein percentage, FP= milk fat percentage, HTINT= heat intensity, MKCASP= milk Kappa casein percentage, CONCRATE= conception rate, MUGKCASP= milk non-glycosylated kappa casein percentage, BTBS= bovine tuberculosis susceptibility, FATTH= fat thickness in the 12th rib, RFI= residual feed intake, NRR= non-return rate, MSPD=milking speed, BD= Body depth, FTPL=front teat placement, PL= productive life span, RUMWD= rump width, STR=milk strength, UC=udder cleft, LMY=lean meat yield, EY= energy of milk yield, BW= birth body weight, BVDV= bovine viral diarrhea susceptibility.
NCBI genes. 287026= phospholipase C beta 1, 506426= crystallin zeta protein encoder, 282257= subunit 1 of interferon alpha and beta receptor, 526800= ankyrin repeat domain 44, 19122= prion protein, 521004= solute carrier family 39 member 10, 338031= FMS-related receptor tyrosine kinase 4.
Traces of selection (protein-coding genes). TMX4= thioredoxin-related transmembrane protein 4, PLCB1= phospholipase C beta 1, MIR2285M-1= microRNAs involved in post-transcriptional regulation of gene expression, ATP5O= ATP synthase peripheral stalk subunit, OSCP= ATP synthase peripheral stalk subunit, ITSN1= intersection 1, CRYZL1= crystallin zeta protein encoder, DONSON= DNA replication fork stabilization factor, SON= DNA and RNA-binding protein, GART=phosphoribosylglycinamide formyltransferase synthetase, Phosphoribosylaminoimidazole synthetase, DNAJC28= heat shock protein family, TMEM50B= transmembrane protein 50B, IFNGR2=interferon gamma receptor 2, IFNAR1= interferon alpha and beta receptor subunit 1, LOC104970778= uncharacterized RNA gene, IL10RB= interleukin receptor subunit beta, IFNAR2= interferon alpha and beta receptor subunit 2, LOC526226= histone H4, OLIG1= oligodendrocyte transcription factor 1, OLIG2= oligodendrocyte transcription factor 2, TMEM192= transmembrane protein 192, KLHL2= kelch of family 2, MSMO1= methylsterol monooxygenase 1, CPE= carboxypeptidase E, LOC101903170= uncharacterized RNA gene, SLC39A10= solute carrier family 39, DNAH7= dynein axonemal heavy chain 7, STK17B=serine/threonine kinase 17b, LOC531691= HECT, C2 and WW domain containing E3 ubiquitin protein ligase 2, LOC107131408= olfactory receptor family 5 subfamily W member 39, LOC100125913= uncharacterized gene, LOC101902704= C-type lectin domain family, 7, A, FLT4= fms-related receptor tyrosine kinase 4, CNOT6= CCR4-NOT transcription complex subunit 6, GFPT2= glutamine-fructose-6-phosphate transaminase 2, MAPK9= mitogen-activated protein kinase 9, RASGEF1C= RasGEF domain family member 1C.
In the study population, ROHs that have been maintained as a result of the selection process of the family system population were identified. In these conserved regions, associations of SNP markers, QTL and gene are found, which are mostly related to characteristics of economic interest in the dairy industry, such as milk production and composition, fertility parameters, susceptibility to diseases, body conformation, feed efficiency and some other characteristics such as carcass composition, which could be taken as traces of selection (Table 3). These results show the traits that have been included in the selection processes in the population, either intentionally because of the selection made by cattle farmers or unintentionally because of the availability of genetic material in the market, since, by using AI, the choice of bulls guides the cattle farmer to modify the genetics of their animals in the way that AI companies do.
Conclusions and implications
The dairy cattle from the FDS have ancestral origins from countries that are suppliers of genetic material internationally, such as the US and GBR, showing no evidence of recent crossbreeding with other dairy breeds. Within the studied population, it can be observed genetically homogeneous, with a lower number and length of ROHs than animals in specialized production systems, reflecting a wide genetic variation caused by a low intensity of selection. In this work, ROHs that have been maintained as a result of the selection process were identified, which are mostly related to characteristics of economic interest in the dairy industry. The results of this study reflect the existence of a low level of inbreeding in the population and a greater genetic diversity in this population compared to those found in specialized systems, so it is possible to carry out genetic improvement work aimed at the characteristics of interest of the producers through selection, without inbreeding compromising the productivity and health of the population.
Acknowledgments and funding source
Project funded by INIFAP-CENIDFyMA with the name “Development of a sustainable comprehensive strategy to increase the availability of good quality Holstein replacements in the family milk production system in Mexico” with SIGI Number: 15352034772.
Conflict of interest
The authors declare that there are no conflicts of interest.
Literature cited: