https://doi.org/10.22319/rmcp.v16i1.6304
Article
Proximate chemical analysis of waste from craft brewing and its acceptance in backyard pigs (Sus scrofa domesticus)
Gerardo José Cuenca-Nevárez a*
Oscar Luis Torres Barberán a
Maritza Viviana Talledo Solórzano a
Said Enrique Jiménez-Pacheco b
Danny Leonel Cuenca Nevárez c
Víctor Hugo Nevárez Barberán d
a Universidad Técnica de Manabí-Chone-Manabí-Ecuador. Facultad de Agrociencias. Ecuador.
b Universidad de Veracruz. México.
c GenteOil. Ecuador. Puyo-Pastaza-Ecuador.
d Universidad Laica Eloy Alfaro de Manabí-Extensión Sucre-Manabí-Ecuador.
*Corresponding author: gerardo.cuenca@utm.edu.ec
Abstract:
The items incurred in pig production determine about 50 % of the productive cost of the activity. Craft brewing produces solid waste, which, when treated, can be considered to be used as food; therefore, the objective of this research is to characterize the chemical components of the waste from the production of craft beer, where the following values were obtained: dry matter 84.77 %, ash 2.54 %, fat 1.98 %, crude fiber 4.85 %, protein 10.86 %, nitrogen-free extract 64.54 %, and total digestible nutrients 73.21 %. Next, a group of backyard pigs were adapted to feed on waste from craft beer production in a substitution of 40 % and 60 %, and the remaining was commercial balanced feed; where weight gains of 1.09 kg d-1, feed conversions of 3.95, carcass yields of more than 80 %, and back fat thickness of 25.61 mm were achieved. Regarding apparent digestibility of nutrients, the following was found: dry matter 77.09 %, crude ash 63.87 %, crude protein 69.20 %, crude fiber 46 %, fat 54.08 %, and gross energy 78.7 %; this determines the prospects of the partial use of this waste in feed and energy requirements within the backyard pig production.
Keywords: Feed, Yield, Productivity, Pig breed, Brewery waste.
Received: 08/08/2022
Accepted: 23/10/2024
Introduction
Craft beer is one of the alcoholic beverages with a high growth in demand by consumers worldwide, which implies an increase in production(1); 20 million t of solid waste are generated in this industry(2). According to the Association of Craft Brewers of Ecuador “ASOCERV” (for its acronym in Spanish), in 2018, the production was 30,730 hectoliters, that is, approximately 614.6 t of waste in Ecuador.
Solid waste represents 85 % of total production(3); this waste comes from separating the must in the filtration stage prior to the milling and maceration stages(4). In addition, for every 100 L of craft beer, 20 kg of solid waste is generated(5). Waste has high nutritional and functional properties such as proteins, fibers, lipids, carbohydrates, vitamins, phenolic compounds, and minerals(6). Likewise, the high fiber and protein contents of some wastes can be used to feed humans and animals(7). Therefore, these wastes constitute no-cost or low-cost potential raw material, rich in organic matter, with availability all year round for agroindustry use(8).
Digestibility in animal feed is considered one of the most important aspects since the nutritional quality of the inputs is assessed depending on their solubility, the extent of their chemical hydrolysis, and the enzymatic digestion in the intestine(9). One of the main challenges in agribusiness is the recovery and valorization of this waste through the application of a circular economy model(10). For this reason the present research aimed to determine the nutritional composition and digestibility of solid waste from craft brewing and to determine its acceptance in the pig diet.
Material and methods
The present research was carried out in two stages: the first was the laboratory analysis and the second corresponded to feeding craft beer waste to pigs. The samples required for the research were obtained from the craft brewing process of the Technical University of Manabí in the Laboratory of Agroindustrial Processes, located in the Chone Cantón on the Boyacá road km 2 1/2, Ánima site, in which 2 kg of the waste was collected, which was crushed and sieved (4 mm). The samples were stored in airtight bags with pressure closure at room temperature. Each analysis was performed in triplicate.
First phase: Proximate chemical analysis of solid waste from craft beer
Dry matter (DM) determination
Two grams of sample were taken and placed in a porcelain capsule to be put in an oven (Memmert) at 105 °C for 24 h, then it was placed in a drying capsule equipped with silica gel to cool the capsules with the sample and thus prevent them from becoming wet, until they were weighed on an Adams® analytical balance and a constant weight was achieved, in accordance with the standard(11).
Ash (A) determination
On porcelain capsules, 3 g of sample was weighed until it reached a constant weight, then the sample was pre-calcined using a grill and then taken to total calcination in a muffle at 700 °C for 2 h. Finally, the samples were cooled and weighed to determine the percentage of ash according to the current standard(12).
Crude protein (CP) determination
It was performed on a Kjeldahl Vapodest 50® equipment for analyzing total nitrogen according to the standard(13). One gram of sample was used for digestion with 25 ml of H2SO4, then digestion was done with an automatic distiller. Subsequently, the sample was titrated with H2SO4 (0.1N) to determine the percentage of nitrogen present and quantify the protein content, multiplying by the factor of 6.25.
Fat (F) determination
Approximately 2 g of sample was weighed, which was previously dried at 60 °C and it was determined using the Soxhlet equipment with ethyl ether as solvent for 6 h; then, the fat was recovered in previously dried flasks at constant weight; subsequently, the rest of the ether was removed at 100 °C; then, the flask was weighed with the fat and the percentage of ethereal extract was obtained by difference in weights, in accordance with the regulations(14).
Crude fiber (CF) determination
The samples used were the defatted malt samples obtained in the determination of fat. Then, the following was carried out: acid digestion with H2SO4 (0.2N), washes with hot water, and basic digestion with NaOH (0.2N). The analysis of this parameter was carried out based on the weight of the ash in the digested sample, as indicated by the regulations(15).
Nitrogen-free extract (NFE) determination
The content of NFE was calculated with the following formula:
% NFE=100-(% moisture+% ash+% fat+% protein+% crude fiber
Total digestible nutrients (TDN) determination
It was calculated by adding all the organic compounds of the proximate analysis present in the food (crude proteins, ethereal extract, crude fiber, and nitrogen-free extract), multiplied by their digestibility coefficient using the following formula:
TDN=protein 80+NFE 90+crude fiber 50+(fat 90 2.25)
The second phase of the research was carried out on the Tres Hermanos farm, located in the Bravos Grande site of the Chone Cantón in the province of Manabí; the climatic conditions are hot-dry, the temperature ranges between 23 and 34 °C, average relative humidity 38.24 %, and annual precipitation 900 mm.
Second phase: Performance test
The design used was completely randomized with four treatments (Table 1). Twenty-four (24) castrated males of the Landrace x Pietrain breed were used, which weighed 31.4 kg on average and were 80 d old, and they were distributed in each of the four treatments (6 pigs per treatment) and housed in individual pens; the experiment lasted 150 d. All the handling of the pigs for this study followed the guidelines established by the Ecuadorian Animal Welfare Regulations issued by the Agency for Phytosanitary and Zoosanitary Regulation and Control (AGROCALIDAD, for its acronym in Spanish), guaranteeing humane treatment, care, and welfare throughout the experimental period.
The amount of food fed to the animals was according to technical criteria(16); the study factor of this research was the complement of balanced feed of solid waste from the production of craft beer in pig feeding (Table 1).
Table 1: Different harvest waste and balanced feed in pig feeding
T= treatments; CBW= craft beer waste.
The amount of balanced feed and harvest waste was calculated daily and divided into two rations per day, the first was at 0800 h and the second at 1600 h. Intake was determined by the following equation.
Food intake=initial ration-waste
The weight of the animals was recorded at 0900 h every 8 d using a generic brand industrial scale (digital type, maximum weight 150 kg and 110 v); the weight gain of the different treatments was determined by the difference in weights;
Weight gain=initial weight-final weight
Feed conversion was determined using the below formula:
Feed conversion= feed consumedweight increase
The variable of carcass yield was obtained when the animals reached the commercial weight of approximately 100 kg. This variable was determined through the following formula:
Carcass yield= live weight-viscera weightlive weight 100
Back fat thickness was determined with a king’s foot, between ribs 10 and 11; in this area, a cut 10 cm wide by 10 cm long by 10 cm deep was made, and a caliper was used to measure the amount of fat present in the cut.
Apparent nutrient digestibility
The apparent digestibility coefficients of protein, crude fiber, fat, ash, gross energy, calcium, and phosphorus were calculated as follows(17):
% Digestibility= nutrient consumed g-nutrient in feces (g)nutrient consumed (g) 100
The data were processed using the free version of the R statistical program. The effect of the treatments on each of the variables analyzed was evaluated through the mean difference using Fisher’s LSD test (P≤0.05).
Results and discussion
Proximate chemical analysis of craft beer solid waste
The chemical analysis is shown in Table 2.
Table 2: Results of the proximate chemical analysis of solid waste from craft beer
NFE= nitrogen-free extract; TDN= total digestible nutrients.
The values of the proximate parameters show that the DM has an average value of 84.77 ± 1.19 %, similar to that reported for craft beer waste, with an average of 84.45 % DM(18). The percentage of ash, from the same authors, reports an average value of 2.43 %, whereas in this study, it was 2.54 ± 0.08 %.
The fat of solid waste has an average of 1.98 % fat for this type of by-products of the craft brewing industry(19). The fat content in this type of by-products is present in a minimal percentage, of which triglycerides have a presence of 67 % of the total composition of the extracts, followed by 18 % of fatty acids(18).
Chemical characterization studies of beer waste determine that the percentage of fiber found was 4.91 %; in contrast, an average value of 4.85 ± 0.19 % was obtained in this study; this allow to determine that these residues have a high concentration of dietary fiber and could contribute to the intestinal transit of animals that are fed with these by-products of the brewing industry(19).
The percentage of proteins in the craft beer waste shows a low value (10.86 ± 0.10 %) compared to other studies that report protein levels around 20 % of DM(20). Another study determines a protein range of 13.16 ± 0.05 % in the stages of the brewing process(21).
The values of NFE and TDN were 64.72 ± 1.09 and 73.21 ± 1.03 %, respectively; these data were similar (64.20 and 73.47 %) to another study, indicating that beer brewing demands carbohydrates(18).
Feed intake
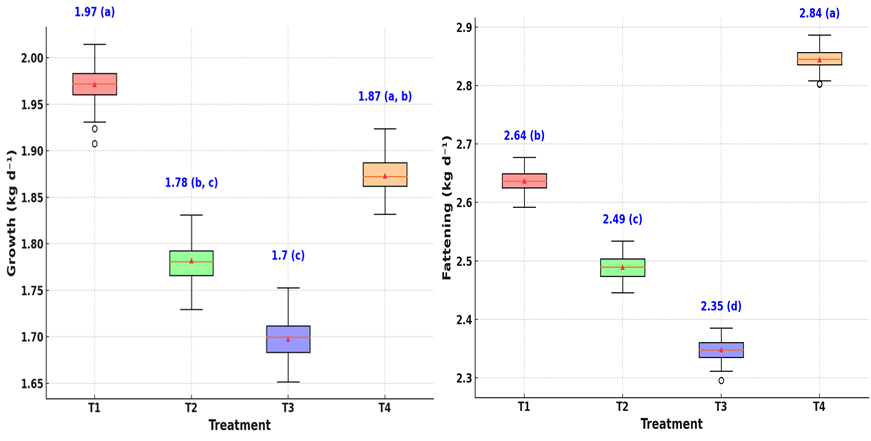
Feed intake was higher in T1 and T4, whereas T2 and T3 had lower intakes (Figure 1); evidence shows that pigs in the growing stage need an intake of 1.81 kg d-1(16). These results are slightly higher than intakes of 1.66 kg d-1 for growth and 2.48 kg d-1 for fattening(22). The recommendation is to partially replace the balanced feed at a percentage of 60 %(23).
Figure 1: Feed intake (kg d-1) at the different supplementation concentrations; a) Growth and b) Fattening
T1= control treatment (100 % balanced feed); T2= treatment 2 (80 % balanced feed + 20 % craft beer waste); T3= treatment 3 (70 % balanced feed + 30 % craft beer waste); T4= treatment 4 (60 % balanced feed + 40 % craft beer waste).
Weight gain
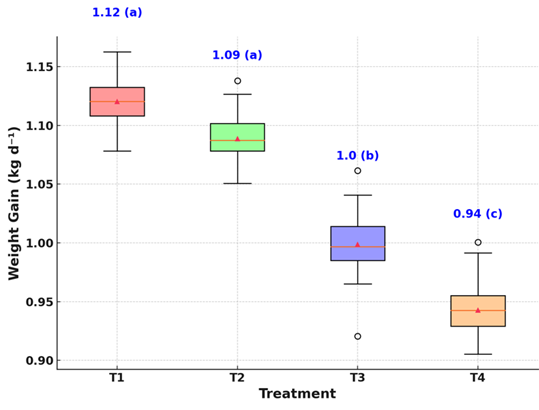
T1 and T2 had the highest weight gains (1.12 and 1.09 kg d-1) in contrast to T3 and T4 (1 and 0.94 kg d-1) (Figure 2). In this case, T1 and T2 did not show significant differences (P>0.05), whereas T3 and T4 did (P≤0.05). The weight gain obtained in the present study is favorable to determine that craft beer waste contains proteins but it should be used as a partial substitute in pig diets(22).
Figure 2: Weight gain in pigs fed with craft beer waste for 10 weeks
T1= control treatment (100 % balanced feed); T2= treatment 2 (80 % balanced feed + 20 % craft beer waste); T3= treatment 3 (70 % balanced feed + 30 % craft beer waste); T4= treatment 4 (60 % balanced feed + 40 % craft beer waste).
Feed conversion (FC)
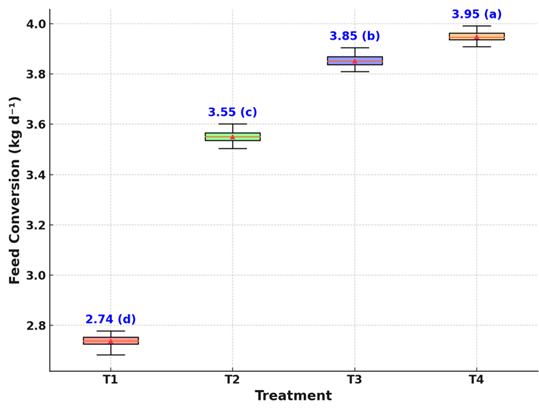
The highest feed conversion was for T4 (3.95), followed by T3 and T2 with 3.85 and 3.55, respectively. The lowest value was for T1: 2.74. These values were higher than those reported in other studies where partial substitutions of corn for cassava meal were established for growing pigs(23). Particularly, the formation of muscle tissue is promoted in the developmental stage(24). Likewise, the values found in this study were higher when comparing the feed conversion of 3.4 with sweet potato as a partial substitute for balanced feed(22).
Figure 3: Feed conversion in pigs fed with craft beer waste for 10 weeks
T1= control treatment (100 % balanced feed); T2= treatment 2 (80 % balanced feed + 20 % craft beer waste); T3= treatment 3 (70 % balanced feed + 30 % craft beer waste); T4= treatment 4 (60 % balanced feed + 40 % craft beer waste).
Carcass yield and back fat
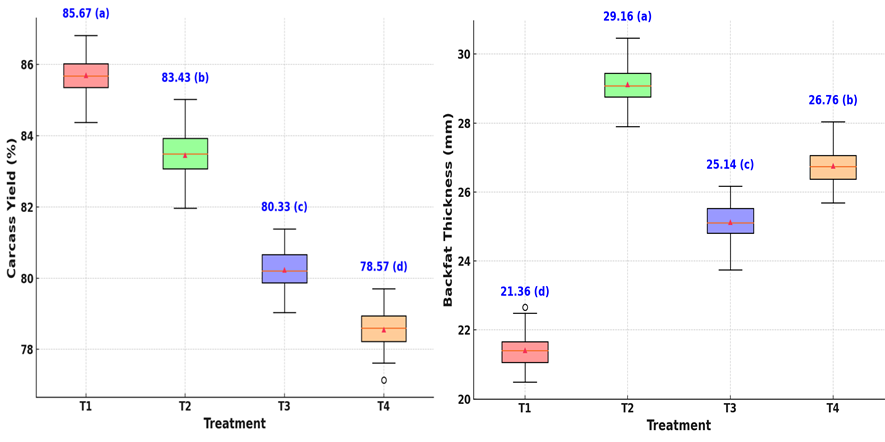
The results are shown in Figure 4. Carcass yield was higher than reported in another study, indicating an average of 65.54(25). In this study, back fat thickness was 25.61 mm, a value that is slightly higher than the standard reported of 25 mm(22) (Figure 4b).
Figure 4: a) Carcass yield in pigs fed with craft beer waste; b) Back fat (mm) in pigs fed with craft beer waste
T1= control treatment (100 % balanced feed); T2= treatment 2 (80 % balanced feed + 20 % craft beer waste); T3= treatment 3 (70 % balanced feed + 30 % craft beer waste); T4= treatment 4 (60 % balanced feed + 40 % craft beer waste).
Apparent nutrient digestibility
Table 3 shows the apparent digestibility coefficients of DM, crude ash, CP, crude fiber, fat, and gross energy of the four treatments analyzed in this study.
In DMaD, there were significant differences between T1, T2, and T3, whereas there were no differences between T1 and T4 (P>0.05); the DM digestibility of the waste from craft breweries was adequate; nevertheless, the results of this study were lower than those reported with tara meal in pigs of the Pig Program of the Amazonian State University (UEA, for its initialism in Spanish)(26). Likewise, the CAaD presented significant differences between all the treatments evaluated (P≤0.05), with the coefficient for T2 being higher, followed by T3, T4, and T1. These values were similar to the average apparent ash digestibility values of 61.12 % in a nutrient digestibility study in pigs(27).
Table 3: Average apparent digestibility coefficients (%) of dry matter (DMaD), crude ash (CAaD), crude protein (CPaD), crude fiber (CFaD), fat (FaD), and gross energy (GEaD)
T1= control treatment (100 % balanced feed); T2= treatment 2 (80 % balanced feed + 20 % craft beer waste); T3= treatment 3 (70 % balanced feed + 30 % craft beer waste); T4= treatment 4 (60 % balanced feed + 40 % craft beer waste).
abc Values with different letters are different (P<0.05).
CPaD showed no significant differences (P>0.05) between T1 vs T2 and T3 vs T4; however, there were differences between T1 vs T2 (P≤0.05). These results were possibly due to low excretions in the amount of fecal nitrogen, a product of the low or no presence of animal proteins in the diets studied(27). CFaD behave the same as the protein, and it was determined that they are relatively low values; this is because the digestibility decreases whenever the fiber content increases(28).
FaD was different between T1, T2 vs T3 and T4 (P≤0.05). On average, there was an apparent digestibility of 55.45 %, a figure that is below that obtained with foods based on poultry viscera(16).
GEaD showed significant differences between T1 vs T2 and T4 (P≤0.05); apparent digestibility was higher in T4, with 80.23 %; this result is related to the percentage of apparent digestibility of gross energy of diets composed of different levels of phytases, with a value of 78.42 %(16).
Conclusions and implications
Incorporating waste from craft brewing into backyard pig diets is a sustainable alternative that improves feed efficiency and production performance, while reducing costs and environmental impact. Although they should not be the only food source, their nutritional composition promotes optimal digestibility and benefits in carcass quality, highlighting their viability as a supplementary feeding practice in small and medium-scale pig production.
Financing
This research has not received specific support from public sector agencies, commercial sector, or non-profit entities.
Conflict of interest
The authors declare that they have no conflict of interest regarding the publication of this paper.
Literature cited: