https://doi.org/10.22319/rmcp.v13i4.6065
Article
Effect of weight and body condition score from pregnant cows on the carcass characteristics of their progeny: Meta-analysis
Sander Martinho Adams a*
John Lenon Klein a
Diego Soares Machado b
Dari Celestino Alves Filho a
Ivan Luiz Brondani a
Luiz Angelo Damian Pizzuti a
a Universidade Federal de Santa Maria. Laboratório de Bovinocultura de Corte. Av. Roraima nº 1000 Cidade Universitária, Camobi, Santa Maria - RS, Brazil.
b Instituto Federal de Educação Ciência e Tecnologia Farroupilha – Alegrete. Brazil.
*Corresponding author: sander.adams@hotmail.com
Abstract:
The objective of the meta-analysis was to evaluate the effects of beef cows weight variation during the 2nd and / or 3rd trimester pregnancy on some parameters of the progeny carcass. The cow weight gain during this gestational period was calculated to standardize the treatments: moderate loss (ML= cows that lost 0 to 5 % of weight) and moderate gain (MG= cows that gained 0 to 5 % of weight). The effect size for all parameters was calculated as medium difference (MD) with a 95% confidence interval and heterogeneity determined using the Q test and the I2 statistic. A random effects meta-analysis was performed for each indicator separately as the medium control and experimental groups. The cow’s weight variation during the studied time variation did not influence the progeny carcass characteristics (P>0.05). Although, a trend towards greater hot carcass weight (P=0.15) and thickness of subcutaneous fat (P=0.10) was observed in calves from MG cows in relation to calves from ML cows. However, the meta-analysis demonstrated that small variations in cow weight during the final half of pregnancy do not affect progeny carcass characteristics.
Key words: Beef cows, Marbling. Steers. Subcutaneous fat.
Received: 16/09/2021
Accepted: 30/05/2022
Introduction
Among factors that can influence the postnatal performance of beef cattle, it can be highlight the cow nutritional insults during pregnancy, uterine changes, also known as fetal programming. The prenatal development of cattle influences productive performance throughout the postnatal period(1). The authors add that the number of muscle and fat cells an animal will have throughout its life is determined in the fetal phase and is influenced by pregnant cow nutrition, because the myogenesis and adipogenesis processes are exclusive from the fetal period(2). Thus, Du et al(3), conclude that calves of cows kept under restricted supply of nutrients during pregnancy have a compromised meat production potential.
According to Reynolds et al(4), the structural and functional changes in organs and tissues caused by the supply of nutrients during pregnancy serve to allow a rapid adaptation of the developing fetus to the pressure of uterine environmental selection. These changes can be related to the health and productive potential of the progeny in adulthood. However, the nutritional challenge during fetal formation can form a phenotype with greater adaptability when nutritional conditions were more challenging in the postnatal period(5).
Thus, the effects of fetal programming are more noticeable in the first months from progeny's life(6). The authors state that the real effects of fetal programming in beef cattle are still contradictory and need further clarification, since there are many divergences between researches, such variability of the studied nutrients, gestational period and intensity of nutritional restriction, as well the progeny characteristics evaluated. Therefore, the objective of this meta-analysis was to evaluate the effects of cow weight variation during pregnancy at progeny carcass characteristics.
Material and methods
Literature search
Literature searches were performed using specific search databases on the platforms: Scientific Electronic Library Online (https://scielo.org), Portal de Periódicos Capes (https://www.periodicos.capes.gov.br), ScienceDirect (https://www.sciencedirect.com) and Google Scholar (http://scholar.google.com). The searches were based on the keywords: “fetal programming in beef cows and the performance of steers progeny” or “fetal programming in beef cattle and progeny performance.” The literature searches included publications from the last ten years (2009 - 2019).”
This meta-analysis was performed using combined data from 10 studies (9 peer-reviewed articles, 1 doctoral thesis), with a total record of 1053 calves during termination and after slaughter phases. When possible, the same study was inserted two or more times in the meta-analysis database. The reviewed studies evaluated the effects of maternal nutrition during gestation on the postnatal performance of progeny, as described in Table 1.
Table 1: Description of the studies included in the database for conducting the meta-analysis
Study | Year | Local | Cow Breed | Sex | Initial BW1 | Comparations | Number of observations | |||||||
HCW | SFT | M | LDA | |||||||||||
7 | 2013 | USA | AxC | All | 534 ± 14 | Supl. x No Supl. | 228 | 228 | 228 | 228 | ||||
7 | 2013 | USA | AxC | All | 534 ± 14 | High ECC x Low ECC | 228 | 228 | 228 | 228 | ||||
8 | 2009 | USA | AxS | Male | 498 ± 15 | Supl. x No Supl. | 24 | 24 | 24 | 24 | ||||
9 | 2019 | ARG | A | Male | 408 ± 54 | High CP x Low CP | 24 | 24 | 24 | 24 | ||||
10 | 2015a | USA | AxS | Male | 440 ± 28 | Positive energy status x Negative | 11 | 11 | 11 | 11 | ||||
11 | 2015b | USA | AxS | All | 463 ± 3 | Positive energy status x Negative | 101 | 101 | 101 | 101 | ||||
12 | 2013 | USA | A | Male | 575 ± 9 | Supl. x No Supl. | 40 | 40 | 40 | 40 | ||||
13 | 2015 | USA | AxS | Male | 600 ± 7 | Supl. x No Supl. | 71 | 71 | 71 | 71 | ||||
14 | 2016 | USA | AxS | Male | 684 ± 7 | 100% TDN x 125% TDN | 86 | 86 | 86 | 86 | ||||
15 | 2019 | BRA | CxN | Male | 413 ± 8 | Weight Gain x Moderate Loss | 240 | 240 | - | 240 | ||||
Total | - | - | - | - | 1053 | 1053 | 813 | 1053 | ||||||
Cow breed, A= Aberdeen Angus; S= Simental; C= Charolês; N= Nelore.
1 Initial body weight (kg) of cows and ± SEM.
Variables, HCW= Hot carcass weight; SFT= Subcutaneous fat thickness; M= Marbling; LDA= Longissimus dorsi area.
CP= crude protein; TDN= total digestible nutrients.
Inclusion and exclusion criteria
In total, 21 studies published between 2009 and 2020 were identified from the pre-established search. The criteria established for inclusion of studies in database were: 1) possibility of calculating cow average daily weight gain during gestation and adequacy to treatments; 2) provide carcass progeny variables; 3) the period of nutritional insult occurs in second or third pregnancy trimester (cow greatest demand); and 4) report information on sample size and variability measurements of interest (i.e. deviation or standard error). In case of studies that reported the standard error of mean (S.E.M.), the standard deviation (σ) was it obtained through the equation:
A total of 11 studies obtained by the search terms were excluded from this meta-analysis because they did not answer the criteria mentioned above: criterion 1) 6 studies excluded; criterion 2) 2 studies excluded; criterion 3) 3 studies excluded. A large number of studies were excluded from this research for not meeting the inclusion criteria. In addition, this is justified by the wide variation between studies, especially concerning the intensity of food restriction and distance between treatments, period of food restriction, as well as the great diversity of variables evaluated, as reported by Klein et al(6) in a literature review on the subject.
Data selection and group formation
Four carcass traits of the progeny selected as response variables, including males and females. For this meta-analysis, the measurements of hot carcass weight (HCW), obtained prior to entering the cold chamber, subcutaneous fat thickness (SFT), marbling and Longissimus dorsi area (LDA) used. These last three measurements obtained in the Longissimus dorsi muscle between the 12th and 13th ribs. The average daily weight gain (ADG) evaluated during the breastfeeding period, and the post-weaning ADG considered as the daily weight gain of calves during the rearing phase.
The weight variation of cows during gestation was used to standardization the tested effects (treatments), according to the equation below:

where WV represents the variation in weight of the cow between the beginning of the experimental period and calving; IW represents the weight of the cow at the beginning of experiment; FW represents the weight of cow at calving.
This standardization was necessary due to great variability of treatments of the researches included in the database. Thus, the meta-analysis consists of two groups according to weight variation classes: moderate loss (ML= cows that lost 0 to 5 % of weight during gestation) and moderate gain (MG= cows that gained 0 to 5 % of weight during gestation). In this meta-analysis, the moderate loss (ML) is used as a control group. The data for each study, such as number of replicates, means and standard deviations, organized in Microsoft® Office Excel® spreadsheets for further analysis.
Meta-analytical procedure
Statistical analyses were performed using the software R version 4.0.2(16), through the ‘meta’ package, ‘metacont’ function(17). Egger’s linear regression asymmetry was used to examine the presence of publication bias(18), with a significant bias value when P<0.05, through the 'metabias' function. In addition, funnel plots were used to evaluate publication bias in meta-analysis through the 'funnel' function. The funnel plot graphically shows the precision of the estimated intervention effect, where smaller studies had a wider variance and larger ones had less spread of variability. In the absence of bias, the funnel plot should be approximately symmetrical. The effect size was calculated as the mean difference (MD), which is the difference between the control and experimental groups (subgroups weight gain and severe loss WG and SL from cow’ body weight). The MD requires that all studies have the same unit of measurement but allows for the interpretation of effect size in the original units(19). The effects of variation in the weight of the cow during gestation were expressed in forest plot graphs, constructed from the 'forest' function, using the estimated MD. The meta package provides a forest plot with the effect size and weighted contribution to each study from fixed and random effect models(17).
The consistency of results between the experiments was quantified using the measures of heterogeneity of the Chi-square test (Q) and I2 statistics(20), which quantifies the impact of heterogeneity on the meta-analysis, whit a mathematical criterion independent of the number of studies and the metric effect of each treatment. Although the Q test is helpful in identifying heterogeneity, the measure I2 was used to measure heterogeneity(20). The I2 statistic is given by:

where Q is the χ2 heterogeneity statistic and k is the number of trials. The I2 statistic describes the percentage of variation across studies due to heterogeneity. Negative values of I2 are set equal to zero; consequently, I2 lies between 0 and 100%(21). Its value might not be important if it falls within the range 0–40 %. However, a value of 30–60 % often indicates moderate heterogeneity, 50–90 % might represent substantial heterogeneity, and value in the range of 75–100 % represents considerable heterogeneity(22).
Results
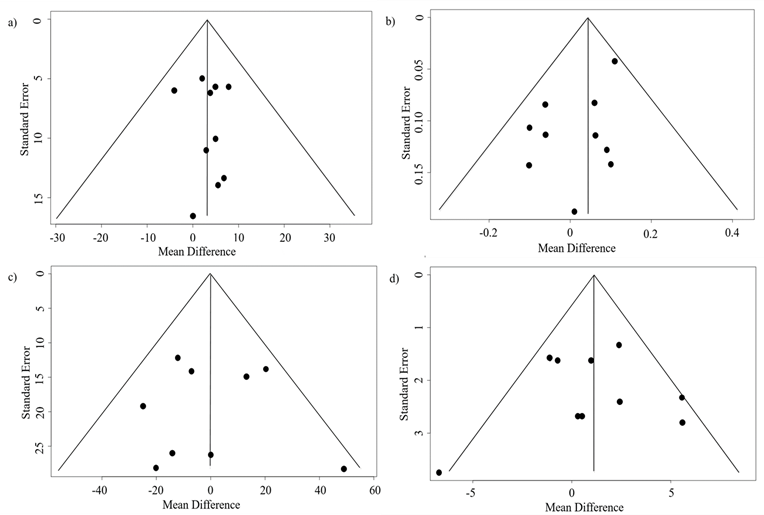
The funnel plots for cow weight variation effect, during pregnancy at progeny carcass characteristics are expressed in Figure 1, and no substantial asymmetry was observed in most characteristics analyzed(22).
The variation from cow weight (ML and MG), the number of studies, the mean gross difference and the size of the effect of each variable, P values and heterogeneity, are demonstrated in Table 2. Egger’s test showed that the variables evaluated don’t have publication bias (P>0.05).
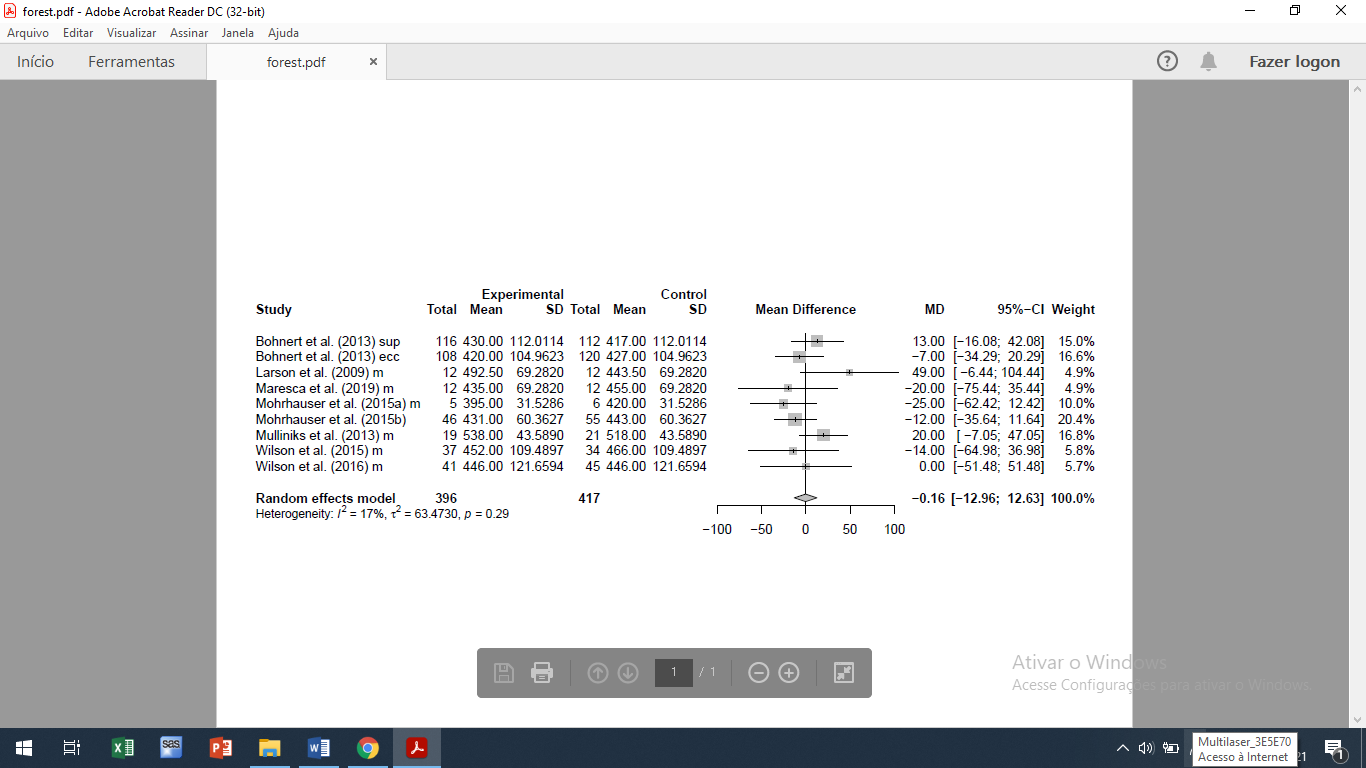
In general, the meta-analysis did not identify major effects of cow weight variation during pregnancy at progeny carcass characteristics (P>0.05). Despite the low studies number published in this research line, the hot carcass weight showed a favorable trend for the progeny of MG cows (P=0.15), which produced 3.25 kg more carcass at progeny from ML cows (Figure 2). Likewise, animals from MG cows at gestation end showed tendency (P=0.10) for greater thickness of subcutaneous fat compared to animals from ML cows (Figure 3). The average difference was 0.05 cm between the groups studied.
Figure 1: Funnel plot for cow weight variation during gestation at progeny performance
a) Hot carcass weight; b) Subcutaneous fat thickness; c) Marbling; d) Longissimus dorsi area. Each point represents an individual randomized trial. The y-axis is the standard error of the trials and the x-axis is the effect size. The Larger studies appear toward the top of the plot and cluster around of effect size (mean) and smaller studies appear toward the bottom of the plot. When publication bias has occurred one expects an asymmetry in the scatter of small studies with more studies showing a positive result than those showing a negative result.
Table 2: Effect size and heterogeneity for weight variation in beef cows during pregnancy on progeny performance
ItemA | Number of studies | MD | 95% confidence intervals | P-valueB | Q | P-valueC | I2 (%) | P-valueD |
HCW, kg | 10 | 3.23 | -1.25, 7.72 | 0.1580** | 2.54 | 0.9797 | 0 | 0.7841 |
SFT, cm | 10 | 0.05 | -0.01, 0.10 | 0.1030** | 8.07 | 0.5275 | 0 | 0.0825 |
M, points | 9 | -0.16 | -12.96, 12.63 | 0.9802NS | 9.61 | 0.2932 | 17 | - |
LDA, cm² | 10 | 1.13 | -0.55, 2.82 | 0.1881NS | 15.20 | 0.0857 | 41 | 0.9031 |
AItem, HCW= Hot carcass weight; SFT= Subcutaneous fat thickness; M= Marbling; LDA = Longissimus dorsi area.
BP-value for MD, *Significant at 5% probability; ** Tendency; NS Not significant.
CP-value for Q statistics;
I2, Statistics of the estimated heterogeneity.
DP-value for Egger’s test; - Number of studies (k<10) too small to test for small study effects(18).
Figure 2: Forest plot for hot carcass weight (HCW, kg) of the progeny from cows with different weight variations during gestation
The solid line of the x-axis is the no-effect line and dotted lines represent the estimated difference of the random model; therefore, the points to the left of the line represent a reduction in the trait, while the points to the right of the line indicate an increase. Each square relative weight of the study of the overall estimate of effect size with the larger squares representing a larger weight. The upper and lower bound of the squared line represents the upper and lower confidence intervals of 95% for the size of the effect. The diamond at the bottom represents the 95% confidence interval for the global estimate.
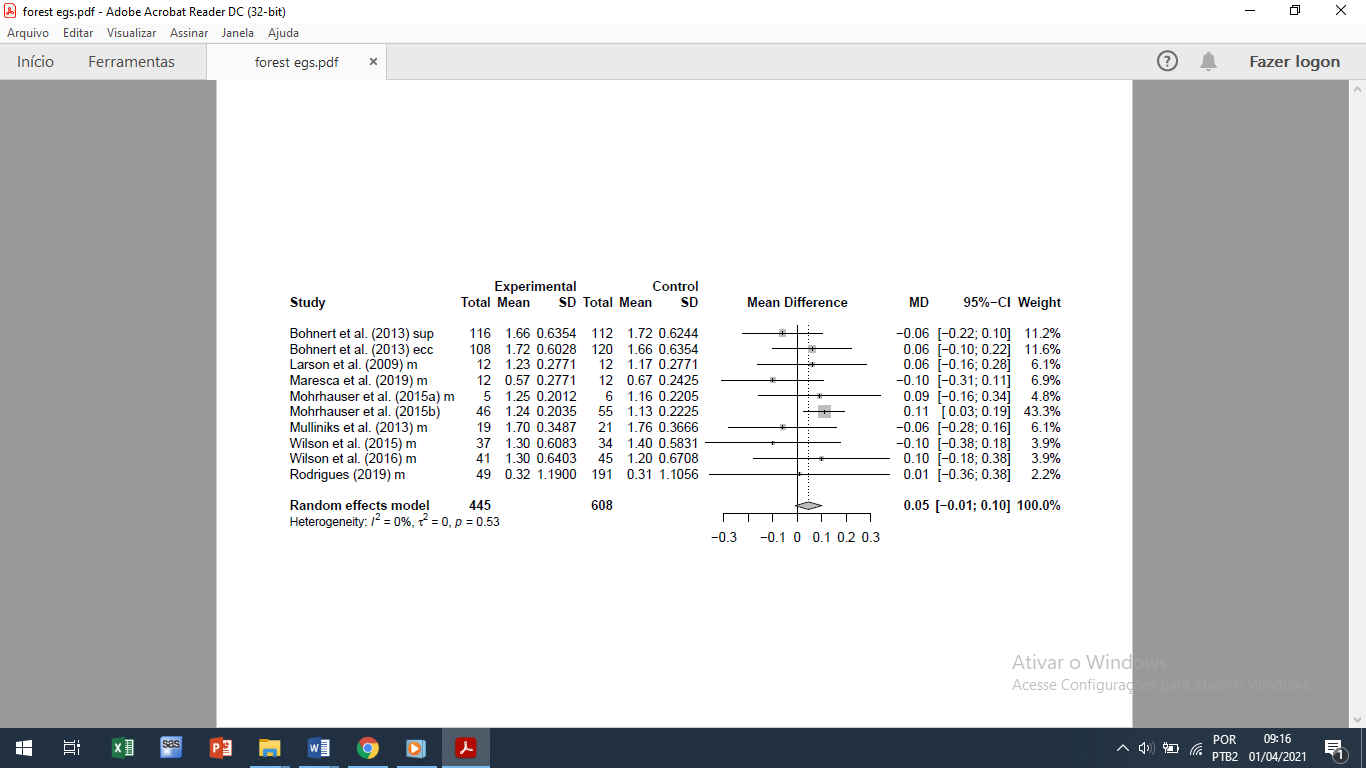
Figure 3: Forest plot for subcutaneous fat thickness (SFT, cm) of the progeny from cows with different weight variations during gestation
The solid line of the x-axis is the no-effect line and dotted lines represent the estimated difference of the random model; therefore, the points to the left of the line represent a reduction in the trait, while the points to the right of the line indicate an increase. Each square relative weight of the study of the overall estimate of effect size with the larger squares representing a larger weight. The upper and lower bound of the squared line represents the upper and lower confidence intervals of 95% for the size of the effect. The diamond at the bottom represents the 95% confidence interval for the global estimate.
The progeny of ML and MG cows didn’t show differences (P= 0.9802) in meat marbling content (Figure 4), with average value of 438 points, equivalent to small marbling content according the classification used. Likewise, the Longissimus dorsi area was not influenced (P= 0.1881) by weight variation from pregnant cows (Figure 5).
Figure 4: Forest plot for Marbling (points*) of the progeny from cows with different weight variations during gestation
The solid line of the x-axis is the no-effect line and dotted lines represent the estimated difference of the random model; therefore, the points to the left of the line represent a reduction in the trait, while the points to the right of the line indicate an increase. Each square relative weight of the study of the overall estimate of effect size with the larger squares representing a larger weight. The upper and lower bound of the squared line represents the upper and lower confidence intervals of 95% for the size of the effect. The diamond at the bottom represents the 95% confidence interval for the global estimate.
* 100 = Practically Devoid; 200 = Traces; 300 = Slight; 400 = Small; 500 = Modest.
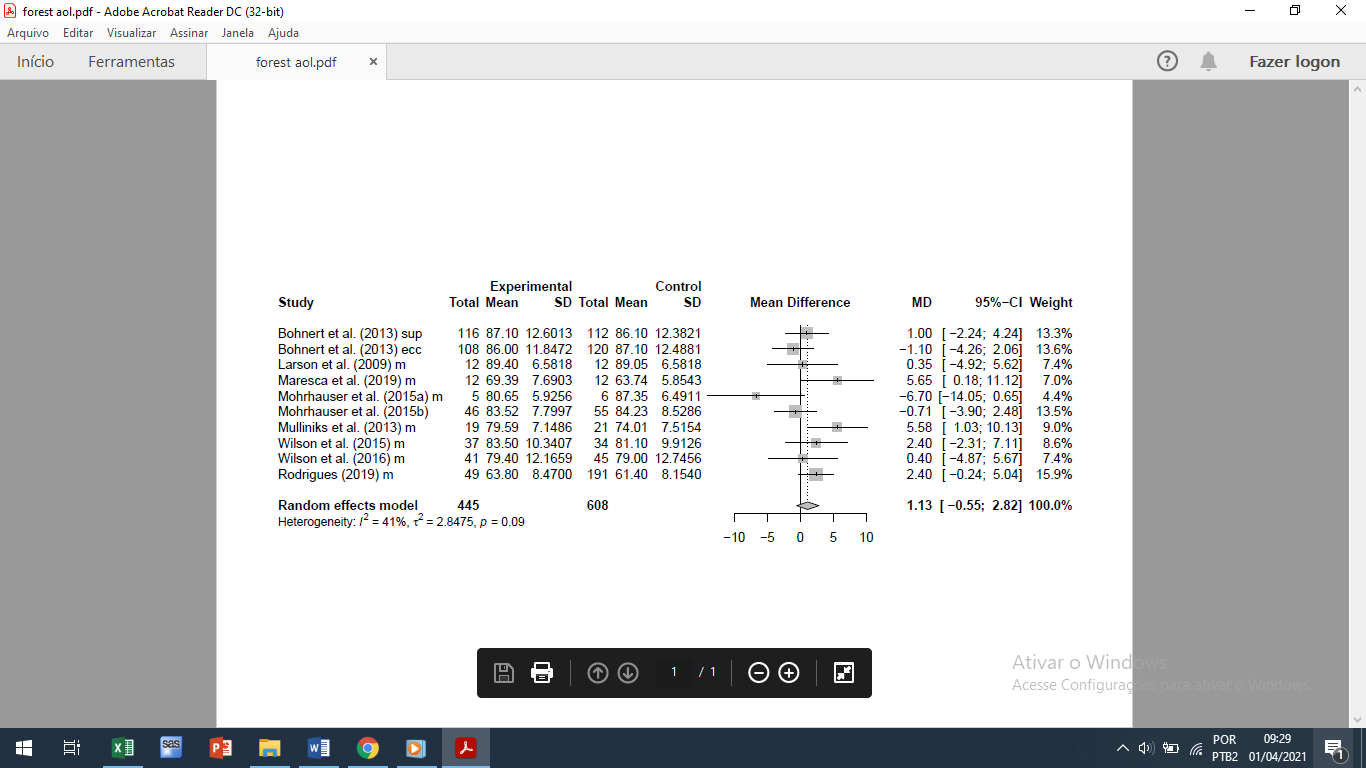
Figure 5: Forest plot for Longissimus dorsi area (LDA, cm2) of the progeny from cows with different weight variations during gestation
The solid line of the x-axis is the no-effect line and dotted lines represent the estimated difference of the random model; therefore, the points to the left of the line represent a reduction in the trait, while the points to the right of the line indicate an increase. Each square relative weight of the study of the overall estimate of effect size with the larger squares representing a larger weight. The upper and lower bound of the squared line represents the upper and lower confidence intervals of 95% for the size of the effect. The diamond at the bottom represents the 95% confidence interval for the global estimate.
Discussion
Among factors that can modify the uterine environment(23), maternal nutrition during pregnancy stands out, which according to the authors can modify developing fetus metabolism and physiology. Several studies have demonstrated interferences from nutrition of the pregnant cow and the consequent variation in cow's weight and body score, but with many divergences, on the progeny performance in adulthood. In the meta-analysis, it was found some influences of cow’s weight variation at final gestation period on the steer’s carcass characteristics.
The trends for higher hot carcass weight and subcutaneous fat thickness for the progeny of MG cows presented in Figures 2 and 3, respectively. The results corroborate the theories described by Du et al(2), who state that improving nutrition during the final stage of pregnancy favors the processes of myogenesis and adipogenesis of progeny, and consequently improves muscle mass and fat in the carcass. In a similar study, Rodrigues et al(24) obtained higher HCW in cows that gained up to 10 % of their body weight during pregnancy compared to cows that lost 0 to 10 % and 10 to 20% of weight during that period. The authors did not observe changes in SFT in that study. Body growth depends on the processes of hyperplasia and hypertrophy of preformed muscle fibers during pregnancy(2), and the nutritional restriction in this period impairs these processes due to the lower nutritional priority compared to other fetal tissues and organs(25).
Unlike subcutaneous fat, the weight variation of the pregnant cow did not alter the intramuscular fat deposition, known as marbling fat (Figure 4). Like the body fat deposition, the formation of adipocytes during pregnancy follows a chronological sequence. In a scheme presented by Du et al(26), there is sequential and overlapping deposition of visceral, subcutaneous, intermuscular and intramuscular fat. Du et al(3) conclude that the formation of intramuscular adipocytes, the last to be formed, can extend over the first months of an individual’s life (approximately 250 d). Thus, postnatal life nutrition could have more effect than fetal programming intramuscular adipogenesis(27), according to the results obtained in the present meta-analysis, since adipocytes, despite being scarce, can increase their size as nutritional leftovers occur. In general, the similarity in adipose tissue deposition may be a consequence of the small variation in weight among cows that lost or gained weight during pregnancy, with an average of less than 5%.
The cow weight gain during late pregnancy did not improve the Longissimus dorsi area (Figure 5), corroborating the findings of Rodrigues et al(24). This result may be a consequence of environmental adaptation of cow calves after birth. Webb et al(5) describe that malnutrition or food restriction during pregnancy ends up producing a phenotype that has greater adaptive skills when exposed to unfavorable environments in adulthood. Ramírez et al(27) conclude that the severe nutrient restriction during pregnancy can also compensate for the individual’s growth after birth, when it is exposed to restricted environments also after birth. Bell et al(28) also add that there may be a plasticity of postnatal rearing systems in regulation of muscle hypertrophy capable of overcoming the negative effects at pregnancy nutritional restriction.
In addition to the greater adaptation capacity from progeny in postnatal life, the fetal programming effects and the nutrients supply of the fetus can be dependent on metabolic adaptation capacity of pregnant cows. Bauman et al(29) describe that nutrient partition of cows through hemorrhagic and homeostatic mechanisms, where the fetus has nutritional body priorities. These mechanisms may explain the mobilization of body reserves and cow weight loss during pregnancy to maintain an adequate supply of nutrients to the fetus under moderate conditions of nutritional restrictions(5). Thus, a small reduction in body weight of the pregnant cow, within 0 to ± 5%, can be accepted in production systems as it does not interfere with the progeny carcass characteristics.
Thus, these results corroborate those of Klein et al(6), who found through the literature review that effects of fetal programming, or pregnant cow nutrition, are more noticeable in the early months of the progeny 's life, with lesser effects with the advancing age of these animals. Brameld et al(30) complement that, with enough time during postnatal life, the animal is able to overcome or compensate for most of these initial differences, resulting in only small (if any) residual effects on body composition in later growth stages. In general, the absence of effects on pregnant cow nutrition at carcass characteristics verified in this study can be attributed to the low weight variation or challenge to pregnant cows. The intensity of nutritional insult is an important factor to be considered in evaluation of the effects from fetal programming on offspring quality. Therefore, the adoption of a nutritional system that provides weight gain to pregnant cows not only depend on progeny performance evaluation, but also on a economic analysis of the entire calf production cycle according the desired goals.
Conclusions and implications
The results obtained in this meta-analysis indicate that small cow's weight variations effects during the second and / or third trimester of pregnancy are difficult to be found in adulthood and post-slaughter carcass characteristics of the progeny.
Literature cited: